Join Paul Tuesday-Friday for webinars each week, for details please see the Webinar Calendar.
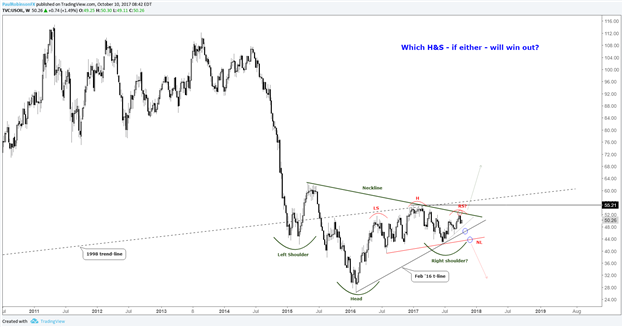
We first started out by taking a look at a couple of big-picture possibilities in crude oil, in opposite directions but the patterns are mirror images of one another. There could be a very large ‘inverse head-and-shoulders’, which if triggered would suggest we see much higher prices, but conversely there is a smaller ‘H&S' formation developing since early 2016. No need to guess which one will work, just need to be patient and wait for a neckline break in either direction. Of course, the sideways chop we have become accustomed to could take us right into 2018 with no resolution to be had. Looking at the near-term, prices look headed lower until at least the trend-line off the June low is tagged near 48.
Crude Oil: Weekly (Battle of formations)

Gold is popping with the help of a softer dollar, but is still viewed through a bearish lens once the bounce loses momentum. 1296/1300 holds key as resistance. Should we see sellers step back in we will look to the December trend-line and 200-day MA (which are likely to arrive very near one another) as key support (~1250/53). Silver will hold a similar fate as gold, of course; it is trading at resistance in the low-17s and a turn lower will shift focus to support in the region of 16.07/13.
The indices are in ‘bull-mode’ but are in overbought territory. It’s a tough spot for both sides of the tape as risk/reward is not favorable given overbought but persistently strong market conditions. The Nikkei is within shouting distance of trading to its best levels since 1996. The DAX has a pair of long-term top-side trend-lines which could soon come into play around 13000/100 as resistance, but will need to see clearly bearish price action unfold to move into the ‘bear’ camp. The FTSE is ready to square off with record highs around 7600, but could struggle on first approach. In the U.S., the S&P 500 continues to hold steady in record territory, but not offering the best set-up at the moment.
For full technical considerations, please see the video above…
Looking for Ideas? Check out our Trading Guides.
---Written by Paul Robinson, Market Analyst
You can receive Paul’s analysis directly via email by signing up here.
You can follow Paul on Twitter at @PaulRobinonFX.


