


S&P 500, VIX, CPI, EURUSD and GBPUSD Talking Points:
- The Market Perspective: EURUSD Bullish Above 1.0000; Gold Bearish Below 1,680
- The new trading week kicked off with an extension of the risk rally in the second half of last week – pushing the S&P 500 to a 4-day climb and an unusual correlation to the VIX
- Perhaps most remarkable in technical terms is the extended pullback from the US Dollar which looks particularly charged against the backdrop of Tuesday’s CPI
Trade Smarter - Sign up for the DailyFX Newsletter
Receive timely and compelling market commentary from the DailyFX team
An Undeniable Extension Risk Assets But Plenty of Skepticism for Conviction
We have opened the new trading week with a continuity of the strong ‘risk on’ drive that defined the second half of this past week; and in doing so, markets continue to operate in defiance of seasonal norms. I’m dogmatist when it comes to historical averages, but there is statistical relevance to these assumptions. When you add in the systemic fundamental issues that are lurking in our current backdrop, there seems plenty of reason to proceed with caution. My skepticism set aside for a moment, there was an unmistakably broad charge in speculatively-aligned markets to start this week. Global stocks, emerging markets and carry trade enjoyed broad (if not intensive) gains which satisfies my criteria for correlation when judging the influence of sentiment. For the S&P 500, the 1.1 percent advance was the fourth consecutive session’s climb which matches the longest stretch (five other instances) since November 8th. We have to rewind 10 months before we find any reference to a longer run. That doesn’t innately translate into a warning, but there are other matters to consider.
Chart of S&P 500 with Volume, 20 and 200-Day- SMAs as well as 3-Day ROC (Daily)
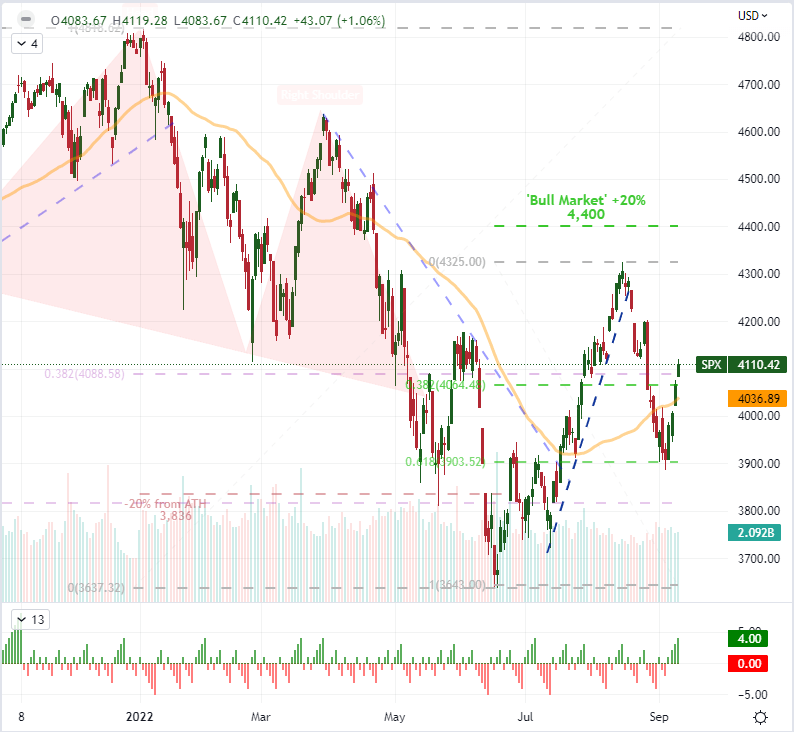
Chart Created on Tradingview Platform
In a four-day rally, we may see the genesis of a long-term bull trend shift that could break through the artificial cap of short-lived runs in 2022 or finds a technical reset before extending further. That wouldn’t sit well with my concerns over aggressive monetary policy trend forecasts nor the lingering fears of recession, but the collective ‘market’ determines what is priority. Another factor that can add to the four-day rally and the seasonal context that suggests the next three weeks have historically averaged losses for the S&P 500 (when we average out the 52 week segmentation back to 1900), is the unusual relationship between the index and the VIX volatility index this past session. Normally, the favored ‘risk’ measure and ‘fear’ index move inversely, but that wasn’t the case Monday. We would see the first 1.0 percent or greater S&P 500 rally and one handle or greater VIX increase in two years. This occurrence is not at all common, and the last two events happened near short-term tops. It is wise not to assume this pattern has to repeat itself, but it should be thought provoking.
Chart of S&P 500 Overlaid with VIX Volatility Index with ‘Meaningful’, Positively Correlated Moves
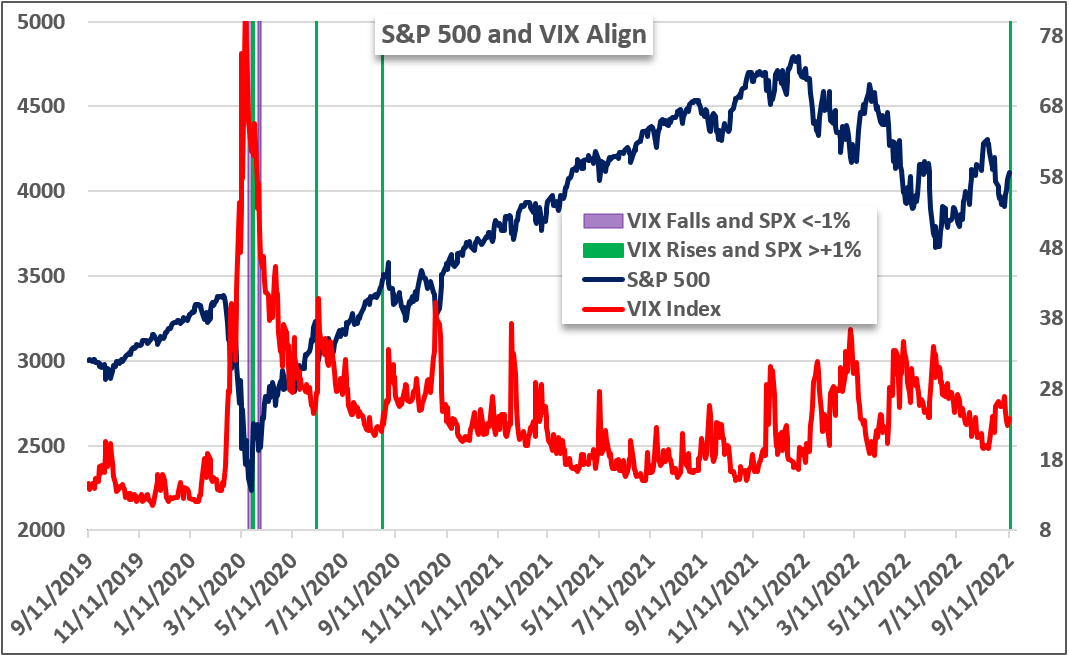
Chart Created by John Kicklighter
The Fundamental Tempo Picks up Considerably
When it comes to motivation for the opening charge from risk assets, I can’t deny that there wasn’t a fundamental mooring for which bulls could lash their forecasts. While I don’t believe there is a balanced bullish case to rest on; nevertheless, the New York Fed’s consumer inflation expectation report for August seemed to strike the exact nerve that the collective had laid bare. According to the bank’s survey, expectations for inflation pressures one year forward cooled to a 10-month low 5.7 percent while the three year hit a multi-year low 3.2 percent. That is distinct fodder for the US CPI release due later today. Furthermore, it reinforces the market’s assumptions of a fast retrenchment of price pressures assessed in breakeven rates. That said, a top in inflation is not an automatic course back to the Fed’s target rate. In fact, the Fed members took pains to warn that near-term inflation figures, recessions and even market swoons would not curb the group’s appetite to get ahead of curve on prices. That said, the FOMC members are in their media blackout, so the forthcoming US CPI is up to the market’s to interpret.
Calendar of Major Macro Economic Events
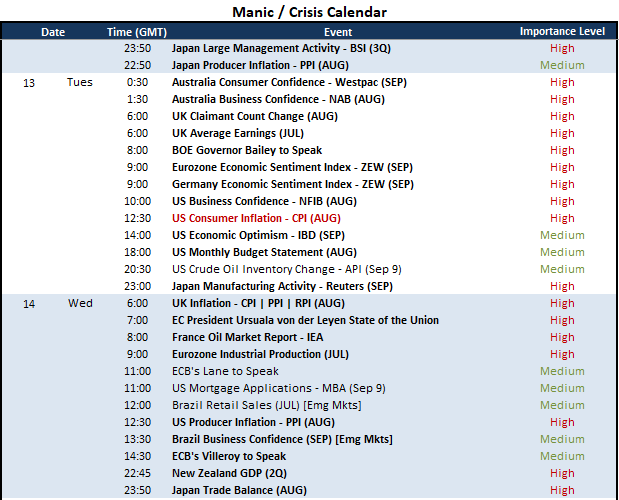
Calendar Created by John Kicklighter
When it comes to the official forecasts for the August consumer inflation report out of the US, the consensus forecast is for a further tempering of headline price pressures from 8.5 to 8.1 percent while core inflation is seen rising modestly from 5.9 to 6.1 percent. A further moderation in pace is expected, which jives with the pullback in the Dollar and bounce in indices. As such, a stronger-than-expected outcome could spur the greater impact. On the other hand, the relief moves we have seen from currency and stocks likely eats into the capacity of a macro relief update generating serious traction. That said, how the market process the news is up in the air. With the Fed in their self-imposed media blackout period in the runup to their next monetary policy event (September 21st), there is no clarification expected from the policy authority. Technically, that makes the situation for EURUSD interesting. While on a trade-weighted basis, the Dollar’s picture is not very remarkable, we are pressuring influential technical resistance on the baseline cross.

Chart of EURUSD with 20-Day SMA and 20-Day Disparity (Daily)
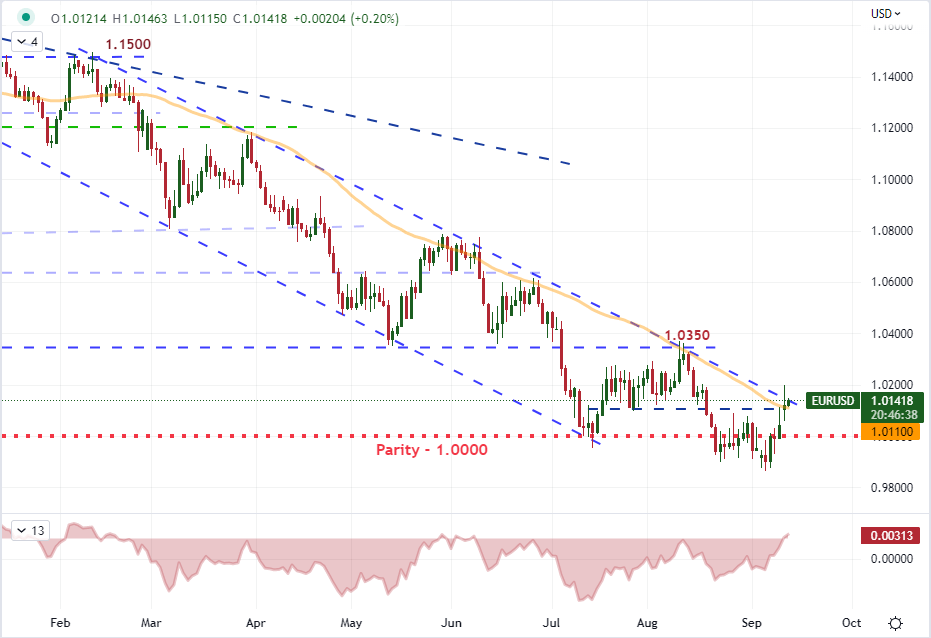
Chart Created on Tradingview Platform
Where is the Dollar Losing Fundamental Strength?
As the US currency eases back slowly from a multi-decade high, it is worth asking what has motivated the nascent deleveraging. At first blush, it would seem that the very early moderation of monetary policy advantage is at play. If there is an expectation for cooler inflation trends, then the Fed could take its foot off the interest rate gas and thereby curb the yield potential associated to US investments. That said, I contend that there is little actual yield advantage being fought over by the majors like the BOE, RBA, BOC and RBNZ. Short of totally stalling out the Fed’s tightening ambitions – which they seem very reluctant to do – there is likely limited run out of this node. The Greenback’s safe haven status is another precarious element to assume that further USD losses can be expected, which leaves relative economic potential as a key theme. Given the BOE’s forecast for a recession in the UK before year’s end, a rebound for GBPUSD looks suspect.

Chart of GBPUSD with 20-Day SMA and 1-Day Rate of Change (Daily)
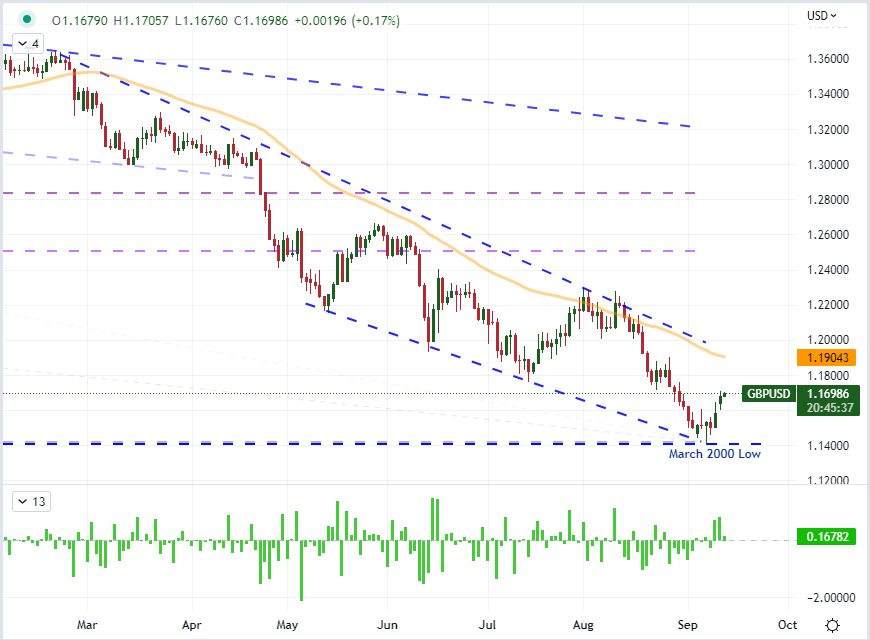
Chart Created on Tradingview Platform
If I were referring to a pair like the Cable, my assessment of bullish scenarios would not rely heavily on an systemic shift in UK economic health from dire to full-bloom. Instead, it seems more practical that the counterpart US optimism is more at risk of losing altitude and spurring action in the currency cross. I asked in a poll what participants via Finance Twitter felt was the probability of a US recession in 2022. The outcome mid-polling was fairly balanced at 54 percent saying ‘yes’ and 46 percent voting ‘no’. That is a lot different than the 82 / 18 percent split I had asking the same question two months ago – just after the supposed peak in US CPI.
Chart of Relative Monetary Policy Standing with Year-End Rate Forecast from Swaps
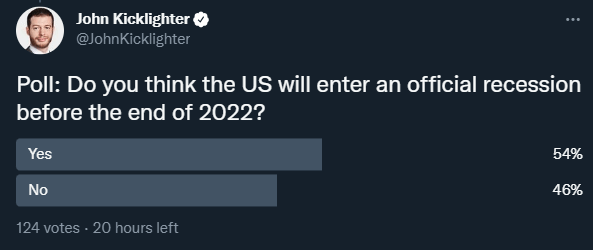
Chart Created by John Kicklighter


