


Inflation, S&P 500, SPDR SPY ETF, VIX and Dollar Talking Points:
- The Market Perspective: S&P 500 Bearish Below 4,075; USDJPY Bearish Below 134.00; EURUSD Bullish Above 1.0100
- Seasonal norms can justify part of the market’s contraction, but it would be a stretch to chalk up the smallest SPX daily range of 2022 and lowest SPY volume since November to ‘the summer’
- Anticipation for the US July CPI release due at 12:30 GMT is likely exacerbating the quiet to levels so extreme that an event-drive break is materially more likely

Summer Trade Can Be Quiet, But This is Extreme
The ‘summer doldrums’ are real, but there are generally limits to how extreme the inactivity should reasonably be expected to congeal. While the seven-week slide in the VIX volatility index and rebound in the underlying S&P 500 looks to be a strong foundation for the degree of realized and expected inactivity we currently find the market in, it would be quite the coincidence for the severity of ‘tranquility’ we have experienced this past session not to be directly exacerbated by the anticipation for this week’s top event risk: the pre-New York trading session (12:30 GMT) release of the US July CPI data. To put as fine a point as I think is necessary on how remarkable our environment is heading into this closely watched motivator of both Fed policy expectations and growth forecasts, the S&P 500’s daily range through Tuesday’s session was a mere 25.2 points. That is the smallest daily range (as a percentage of spot) since December 31st. That is holiday trade before inflation showed up on the scene and recession fears became dining table conversation. I’d say a flip in volatility is a high risk – but you wouldn’t see much of that anticipation in either the VIX, VVIX (volatility of volatility index) or even the VXX short-term volatility ETN.
Chart of S&P 500 with Volume and 5-Day Historical Range (Daily)

Chart Created on Tradingview Platform
A strong part of the lethargy that we are experiencing is likely the product of the medium-term depression in market activity. I mentioned the seven-week slide in the VIX, but there is also more than a few event highlights from the recent past where key events – some with serious surprise quotients – failed to seriously set the markets into motion. Whether you interpret Friday’s strong NFPs as a rebuff of recession fears or the basis for a third 75bp rate hike from the FOMC next month, we did not clear one of the smallest – now 8-day – ranges of 2022. The US-China tension flare didn’t even register on the key market benchmarks and the July 27th big hike added to lift despite its ‘typical’ fundamental implications. That certainly gives the market reason to be confident, but seeing the smallest volume on the SPDR S&P 500 ETF since November 11th should tell us that the quiet belies the serious risk.
Chart of SPDR S&P 500 ETF with Volume and 8-Day Historical Range (Daily)

Chart Created on Tradingview Platform
Why This US Inflation Report Matters?
According to the Federal Reserve, its favorite inflation indicator is actually the PCE deflator that uses the same data used in calculating the quarterly GDP figures. That said, the markets have always maintained a clear preference for the CPI – perhaps because it comes earlier and is released on a Wednesday with plenty of week left to integrate into market view. At the last update, annual inflation growth in the headline basket accelerated to a staggering 9.1 percent pace. That is the highest reading in four decades and not at all unique to the world’s largest economy. There is a possibility that this reading meets, misses or beats the consensus forecast (8.7 percent), but I believe a ‘beat’ would exact the most weight. Why? Over the past week, we have seen more than a few indicators with price forecasts attach to them ease back for the same period. Last week’s ISM service and factory activity reports’ inflation components offered some relief. Earlier this week, the NY Fed’s consumer expectations survey saw a drop in inflation forecasts – but the NFIB’s small business report did raise the threat from inflation to its greater individual threat.
Chart of US CPI YoY With 1 and 2-Year Consumer Inflation Expectations and 5yr-5yr Forecasts (Monthly)

Chart Created on St Louis Federal Reserve Economic Database
When such extreme levels of inactivity meet a ‘capable’ event risk, the short-term volatility response can be severe. For those that prefer trading around the coin flip of event-drive market moves, it usually doesn’t take long to recognize that the initial response isn’t always the ultimate course the market takes. Details matter in this report, including the critical categories that reflect the components of the survey. For example, gas prices dropped 7.5 percent month-over-month from June to July (according to EIA), but housing and food costs have not offered as ready a retreat. Further, corporate-level cost pass through has not abated through the earnings season – just the opposite. Another component of Thursday’s session to watch is how the CPI data is referenced by the Fed officials that are due to speak later in the day. Historical doves Charles Evans and Neel Kashkari are not voters this year on the FOMC, but their accommodative credentials will give important perspective.
Global Calendar of Major Macro Economic Event Risk for the Next 48 Hours

Calendar Created by John Kicklighter
What to Watch from the Markets ‘Medium Term’
While there will be a certain focus on the CPI release’s immediate market impact, I believe it is far more important to see what lasting impact it has. Against the remarkable extension of the VIX slide last week, we have a historical norm that suggests that we were at the time of the year when activity tends to pick up significantly. Deviating is possible as these are simply averages of different circumstances year-to-year, but there is also plenty of risk to fuel market activity should the masses decide to pay attention. If volatility doesn’t just deflate by Wednesday’s close, the very reticent bullish conviction will come under serious pressure moving forward.
Chart of VIX Volatility Index for 2022 YTD and 2021 Overlaid with Weekly Average (Weekly)

Chart Created by John Kicklighter
In contrast to the potential of a tipping point for the VIX, there isn’t as much as an easy path for the Dollar to reverse course. The bull trend of the past year has been knocked back this past month, but is that owing to its cap in interest rate potential, recession prospects or perhaps the risk appetite bid that undermines its safe haven creds? Something to consider in rate forecasts, a trend in inflation for the world’s largest economy is likely to be echoed for the rest of the world. For other central banks to keep up the hikes as the Fed cuts back would introduce economic problems. Further if the combined influence of the American consumer and business sector were to cut back on spending and exaggerate an economic contraction domestically – the demand for goods from trade partners will feel the impact as well. And, as for the risk appetite backdrop from US indices, I’m not true believe. There is willing curiosity at best. If the DXY breakdown Wednesday, that will be a development to investigate closely – if anything for the implications of a EURUSD rally.
| Change in | Longs | Shorts | OI |
| Daily | -10% | -4% | -8% |
| Weekly | -13% | 35% | 0% |
Chart of DXY with 20-Day SMA Overlaid with Fed Funds Implied * VIX Combo, 20-Day Corr (Daily)
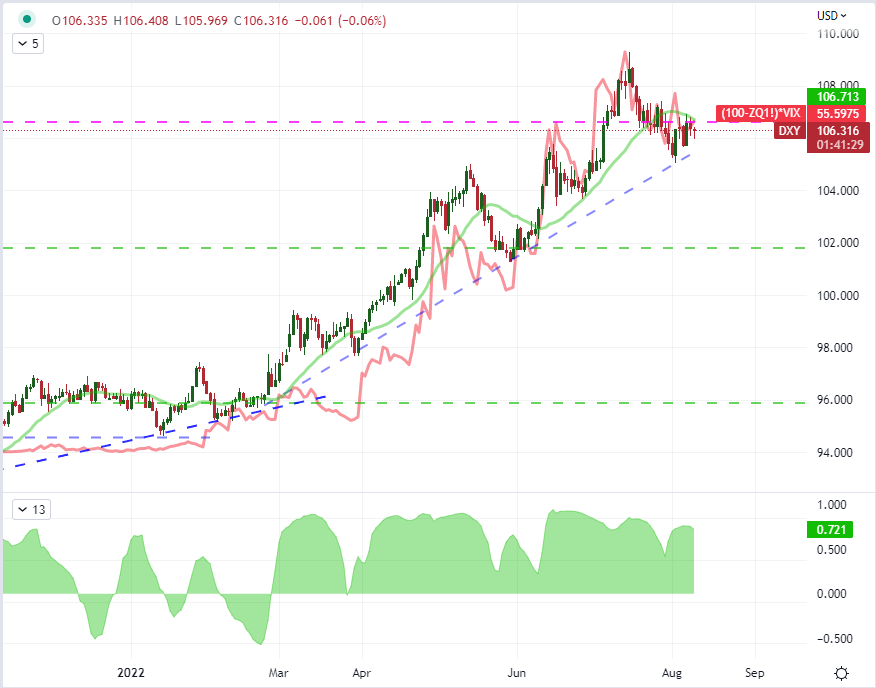
Chart Created on Tradingview Platform


