


S&P 500, Nasdaq 100, VIX, Fed, and Inflation Talking Points:
- The Market Perspective: S&P 500 Bearish Below 4,075; USDJPY Bearish Below 134.00; EURUSD Bullish Above 1.0100
- Despite the charge from multiple fundamental developments – from the scheduled to the unexpected – the S&P 500 would ultimate carve out its smallest trading range of the year
- A break seems a high risk and the historical norms projected for the VIX through the 32nd week of the year on the top event on tap can help catalyze the move

Despite a Run of Important Event Risk, No Break
There was no lack of weighty event risk this past week to motivate the market to a clear ‘risk-oriented’ trend – either bullish or bearish – but the market refused to make up its mind. On the bearish side, the outlook for more oppressive monetary policy and the fresh geopolitical risks from the devolution of the US-China relationship were capable wrenches for the proverbial gears. Alternatively, the stronger than expected NFPs on Friday quieted imminent recession fears while service sector activity (a top proxy for US GDP) unexpectedly jogged higher. If speculative interests were ready to run, the fuel was ready regardless of direction. And yet, we were left with the narrowest six-day trading range on the benchmark S&P 500 since the very beginning of the year. Are market participants waiting for the resolution of something specific? Is the fundamental outlook that finely balanced? Or perhaps is there seasonal factors that are artificially curbing speculative development? In any of these cases, the uneasy peace is not likely to last for much longer.
Chart of S&P 500 with Volume and 5-Day Historical Range (Daily)
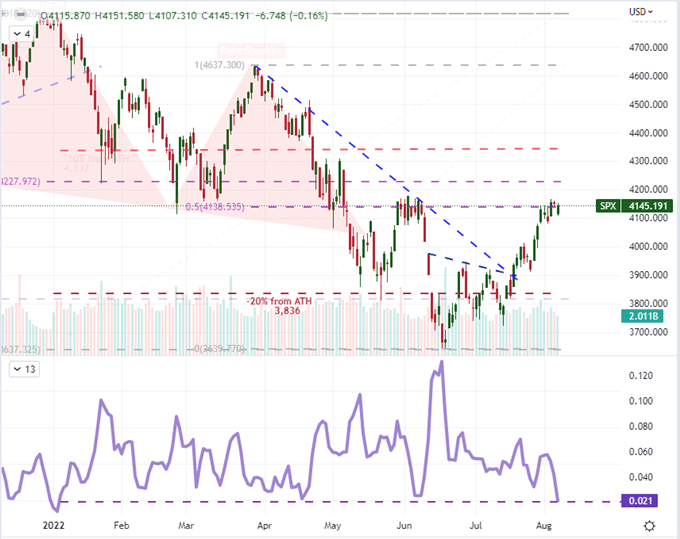
Chart Created on Tradingview Platform
From a bullish resolution view for the capital markets, there has been a very notable swell in risk appetite trending towards the more extreme ends of the spectrum. While the S&P 500 has edged higher and the value-based Dow has trailed that performance, the tech-heavy Nasdaq 100 has found itself just on the cusp of notching a technical ‘bull trend’ – a 20 percent gain from cyclical low. But that isn’t the only area of the market that seems to reflect an appetite for the faster-moving and riskier assets in the market. The recently IPOed AMTD Digital (ticker: HKD) surged by thousands of percent over the pat week before shedding much of its value in the second half of this past week. Just to prove it wasn’t a one-off fluke, the Magic Empire Global (ticker: MEGL) IPO was guided at $4 per share and opened at $97. This is a very concentrated, rather than broad measures of risk, so intensity should not be conflated with conviction.
Chart of Nasdaq 100 Overlaid with Nasdaq/Dow Ratio (Daily)
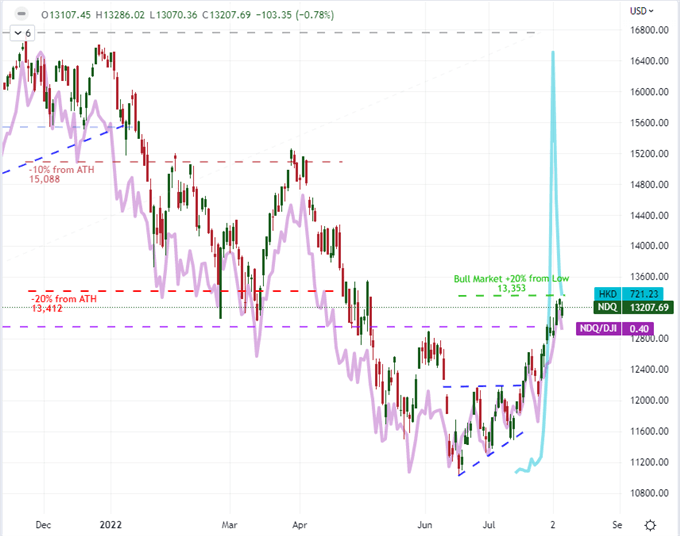
Chart Created on Tradingview Platform
What History and the Calendar Says of the Week Ahead
While there are trends to consider through the past week in regards to how we absorb information and turn it into speculative positioning, there are certainly some conflicts to be considered in historical norms and the docket we have to walk through. As for the S&P 500’s historical average performance for the 32nd week of the year, we have seen a very modest gain averaged over the years. We don’t get into average losses in a weekly or monthly capacity until out in September. Volatility, on the other hand, is a different story. Averaging out the calendar weeks’ performance for the VIX index, the 32nd week of the year historically reflects the beginning of a sharp acceleration in activity levels. In fact, that turn has averaged a start in the 31st week, but the VIX in 2022 has instead registered a 7th consecutive weeks’ decline – matching the longest stretch of decline since early 2019.
Chart of Historical VIX Level by Week Overlaid with 2022/2021 VIX
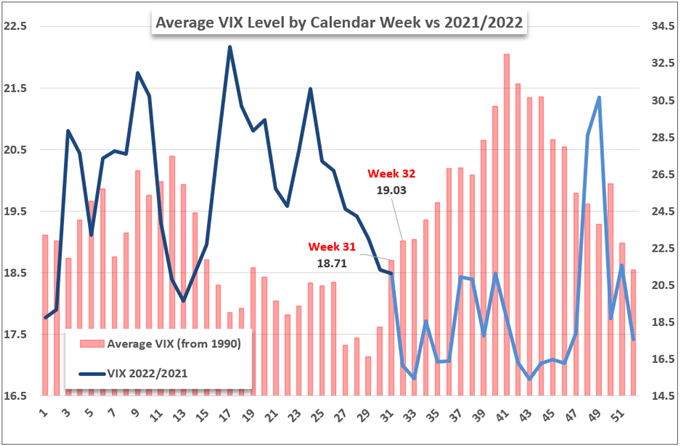
Chart Created by John Kicklighter
From the averages of history to the unique circumstances of 2022, there remains plenty of fundamental pressure to track moving forward. Thematically, I am most concerned about the ever-evolving concern around the tempo of monetary policy and the fears that a recession is just over the horizon. More specifically on the economic docket, there are updates that will tap into these deeper tributaries of fundamental importance. I will monitor the data from China to see its economic health and stand outs like the Bank of Italy’s financial report, but the US inflation and consumer confidence reports are by far the most loaded updates on my radar.
Global Calendar of Major Macro Economic Event Risk for the Next 48 Hours
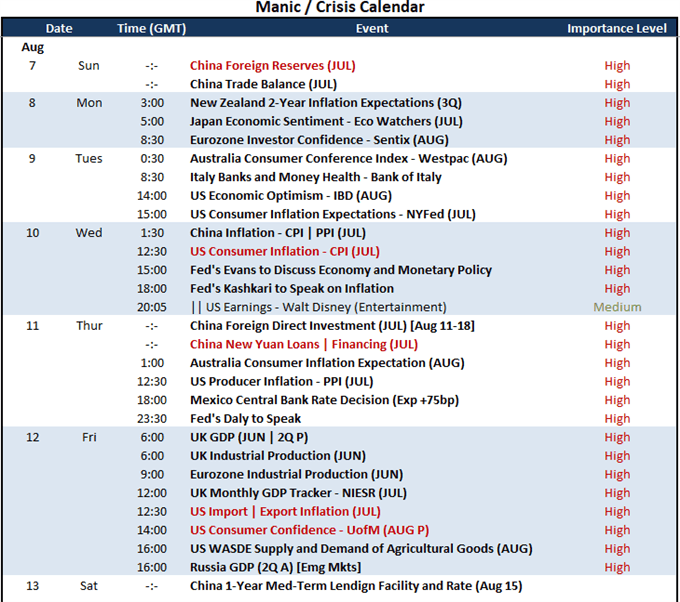
Calendar Created by John Kicklighter
Prepare for Interest Rate and Recession Updates for the US
Through this past week and a number of high profile fundamental developments (RBA and BOE rate decision, the Taiwan spark, US service and factory activity divergence), the July NFPs ended up the top event in many ways. The 528,000 jobs added to the world’s largest economy was more than double the economist forecast and an effective distraction from the steadily growing recession fears. Furthermore, the statistics down the line were generally stronger from the jobless rate’s tick down to 3.5 percent to the average hourly earnings growing a faster-than-expected 0.5 percent. And yet, the Friday’s price action was ultimately defined by a -0.9 percent gap lower. That is because the data was not interpreted so much as a boon for truly staving off a recession but rather bolstering the Fed’s ability to front-load its monetary policy regime to snuff inflation. The probability of a 75bp rate hike at the September 21st FOMC meeting jumped from 34 percent to 71 percent from one day to the next. This suggests a clear preference for fundamental influence which may prove the US CPI release on Wednesday a top potential market mover – whether it continues its charge or finally capitulates.
Chart of Fed Rate Forecast Through Swaps
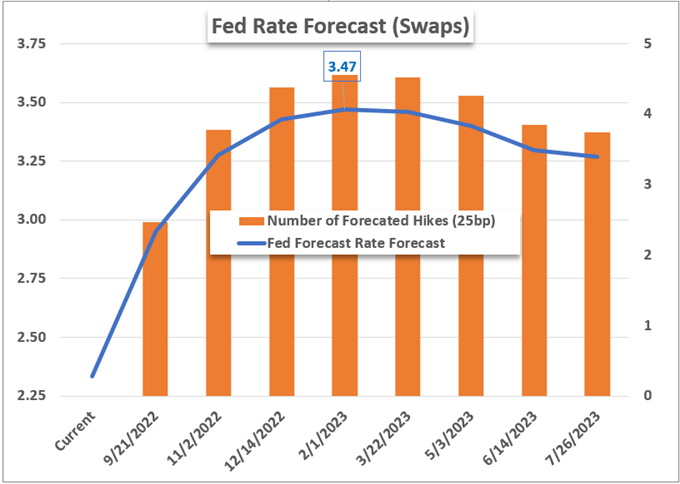
Chart Created by John Kicklighter
After the last update on the US inflation series, the S&P 500 extended its worst three-day drop since the pandemic – and before that nothing comparable since the Yuan-revaluation spark of August 2015. Is there potential for the same scale of response? Certainly. On the other hand, there has been data – from commodity prices to ISM inflation components – that has suggested relief started to seep in this past month. Inflation is a burden in part because of the response it elicits from the Fed and other central banks; but that ultimately leads back to a fear over an economy forced off a track of recovery. Getting to the heart of the immediate circumstances of economic activity, the University of Michigan consumer sentiment survey due on Friday can offer up a timely update on the general economic course. The survey hit a record low in June and experienced a modest bounce in July. What does August have to offer?
Chart of CPI YoY Overlaid UofM Consumer Confidence and Inflation Expectations (Monthly)
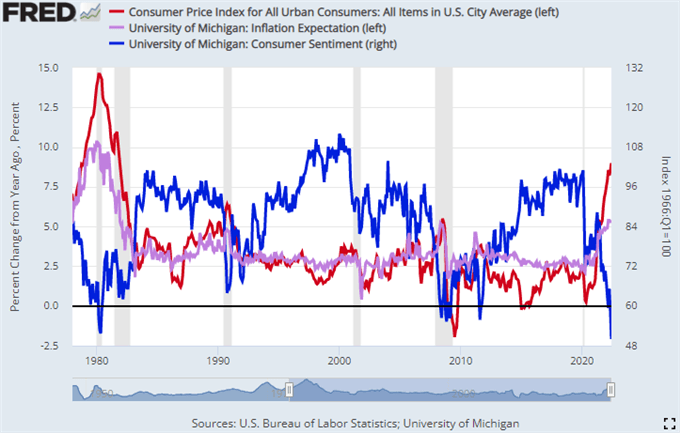
Chart Created on St Louis Federal Reserve Economic Database


