


S&P 500, VIX, Earnings, Recession, GDP, FOMC and Dollar Talking Points:
- The Trade Perspective: S&P 500 Bearish Below 4,075; USDJPY Bearish Below 134.00; EURUSD Bullish Above 1.0100
- As a risk benchmark, the S&P 500’s smallest daily trading range of 2022 Monday suggests markets are anxiously awaiting a catalyst for volatility and perhaps direction
- Wednesday’s FOMC rate decision stands prominently as a likely catalyst this week, but most roads point back to the

Trading Like There is Serious Event Risk Ahead
The trading week opened as if the markets were either unconcerned about their current circumstances or wholly fixed on high profile event risk just slightly further out on the docket. Given the very real risks of recession and financial instability invited by the policy fight against inflation, I am wont to believe that anxiety is the culprit to this week’s slow start. How quiet was the opening trading session of the week? A 0.8 percent range on the day (as a percentage of close) is the smallest trading span since the end of 2021 when we were in the thick of holiday trade. While there is some seasonal influence that we are passing through, this week’s docket is loaded with high profile event risk from global growth forecasts to FOMC rate decision to the official US 2Q GDP release. While we have seen markets in the past where there exists a presumption that the data on tap will either be absorbed to support an optimistic view or otherwise be downplayed, it doesn’t seem like that kind of inherent bias is strong in these markets. If it is anticipation, then the event risk this week stands a good chance of stoking the markets to life.
Chart of S&P 500 with 50-Day Moving Average, Volume and 1-Day Historical Range (Daily)

Chart Created on Tradingview Platform
Putting aside the scheduled event risk for a moment, there is historical precedence to draw on for volatility considerations. Looking to the VIX’s historical averages since its inception, last week represented the absolute lull for the calendar year, while the current week (30th of the year) starts to experience a reversal in market activity. Normally, the biggest jump in conditions happens in the 31st week which happens to align to the beginning of August, but our economic docket this week may better explain structural and unique circumstances better than the mere historical averages.
Historical Weekly Average of VIX Volatility Index vs 2022/2021 VIX (Weekly)
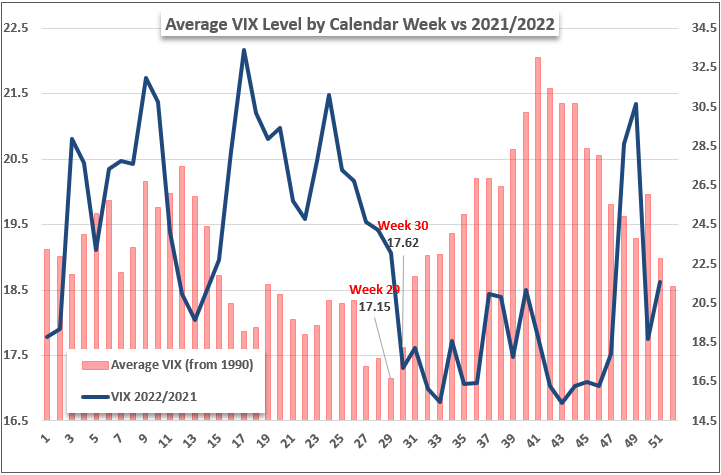
Chart Created by John Kicklighter with Data from S&P
Prioritizing the Market Moving Event Risk Ahead
Looking out over the economic docket through the next 48 hours, there is a very distinct hierarchy of volatility-charged event risk. For the immediate 24 hours ahead, there is good reason to expect most fundamental roads to find their way back to views on economic activity. However, before we dive into the ambiguity – and thereby ripe area for speculation – around an impending recession, there is the Fed rate decision to address. The world’s largest central bank is due to weigh its monetary policy stance on Wednesday at 18:00 GMT, and that will certainly draw the focus and even hope of a significant number of market participants. That said, we seem to have hit a peak forecast for hawkish projections from the US central bank and its major counterparts. Serious debate has grown out of inflation expectations and assumptions over policy groups’ allowance for market fallout. That said, if the Fed and others continue to preach a tolerance for volatility, that latent expectation that central banks are backstops for investors’ interests will continue to erode.
Global Calendar of Major Macro Economic Event Risk for Next Week
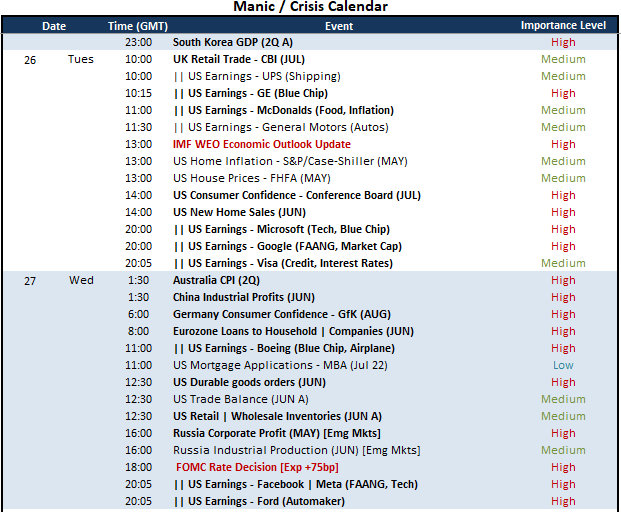
Calendar Created by John Kicklighter
When it comes to the anticipation of the Fed’s policy mix later in the week, there is inevitability a capital market implication. That said, the score for the US Dollar is likely far more direct. The DXY trade-weighted index sported a notably restrained trading session on Monday and has extended the smallest four-day historical range of the month thus far. In other words, anticipation seems to be clouding the market’s actions. That said, the anticipation of volatility in the FX market remains significantly higher than traditional capital markets like equities. Where the VIX volatility index was at its lowest level in months while the volatility of volatility (VVIX) hit a fresh multi-year low for equities, the FX-based EVZ (based on benchmark EURUSD) remains above its 20-day average and in the upper threshold of the past two-years’ range.
Chart of DXY Dollar Index Overlaid with Implied Fed Funds Rate in Dec with 60-Day Correlation (Daily)

Chart Created on Tradingview Platform
Now…About That Recession
While the Fed’s policy decision this week is like a fundamental beacon for traders groping in the dark, the broader economic state of affairs is where these roads seem to all end up. While there will inevitably be a lot of fanfare for the official US government’s 2Q GDP release later this week, I am putting much more emphasis myself on the event risk immediately ahead of us. There are a few key economic updates in Tuesday’s session that deserve a close look: such as the consumer confidence survey from the Conference Board. It was the University of Michigan’s own measure from June that showed confidence from the largest aggregate economic engine in the world (the US consumer) had hit a record low. The Conference Board’s measure on the other hand was only notching an approximate decade low. Will it follow the UofM in its bounce or dash emergent confidence? Meanwhile, earnings will present its own economic reflection. I – like many others – will be focused on the afterhours release of corporate stats from Microsoft and Google (the third and fourth largest market cap companies), but it is the pre-open companies that are drawing my macro attention. GE is a blue chip, GM an auto manufacturer with reference to big purchases, McDonalds will speak to food inflation and UPS can reflect supply chain constraints. It is hard to come up with a more comprehensive list for growth insights. What’s more, after the more than -9 percent drop from Walmart shares afterhours Monday after it downgraded its profit forecast due to consumer spending habits impacted by inflation, attention will be seriously focused.
Chart of Walmart with Volume (60 Minute Chart)

Chart Created on TradingView Platform
For the growth (or ‘recession’) focused update this week with the greatest sentiment potential, I believe the IMF’s updated forecast via its World Economic Outlook (WEO) due at 13:00 GMT is top risk. The official quarterly GDP reading later this week is lagging, consumer confidence is topical and earnings is extrapolated. The IMF’s projections are distinctly growth oriented and they are a respected outlook for which market participants are likely to benchmark their expectations going forward. At April’s update, there was already an 0.8 percentage point cut to the global forecast and 0.3 percentage drop in the US-specific projection. The IMF managing director already warned that a further downgrade is at hand, but now we will see how sharp that revision is.
Table of Growth Forecasts for 2022 from the IMF’s April WEO
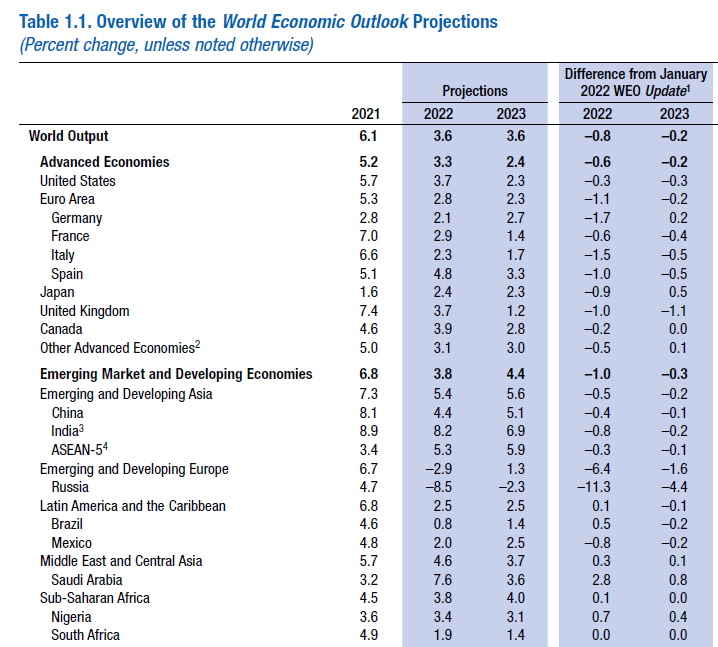
Chart Created by John Kicklighter with Data from Google Trends


