


S&P 500, Earnings, Netflix Monetary Policy, ECB and Dollar Talking Points:
- The Trade Perspective: S&P 500 Bearish Below 4,075; USDJPY Bearish Below 134.00; EURUSD Bullish Above 1.0100
- The S&P 500, as a benchmark for ‘risk trends’, dropped into an official ‘bear market’ through the first half of the year – have we seen the market ‘fully capitulate’ after that slide?
- Earnings will be a key theme Wednesday with the Netflix open and anticipation for Tesla afterhours, but monetary policy is back in view with inflation data from UK, Canada and Germany

‘Full Capitulation’ is an Another Way to Try and Pick a Bottom
There was some notable technical progress from a few prime-positioned ‘risk’ benchmarks this past session. A climb from carry trade and steep rally from the likes of the German DAX were worthy of attention, but it was the S&P 500’s 2.8 percent charge – the third largest single-day rally in two years from the index – that stood out for me. The scale of the move was impressive, but the previous two efforts that outstripped that surge (June 24th and May 4th) very noticeably didn’t produce follow through. In this case, a short-term wedge top was taken out along with the 50-day simple moving average. Technical achievement is one thing, however, and conviction is something completely different. Is there conviction to be found following the loosely correlated groundswell? If the market is in a mood to prioritize optimism, it is certainly possible to elicit lift. The default bid was a familiar charge in the period between 2009 and 2021 – not constant but a frequently returning motivation. At present, the concern around impending recession and returning financial restrictions creates a more complicated backdrop. At the very list, I will reserve my own conviction until after we have clarity on growth (after the IMF’s WEO update) and the FOMC policy decision on Wednesday.
Chart of S&P 500 with Volume, Daily Gap and Daily Change (Daily)
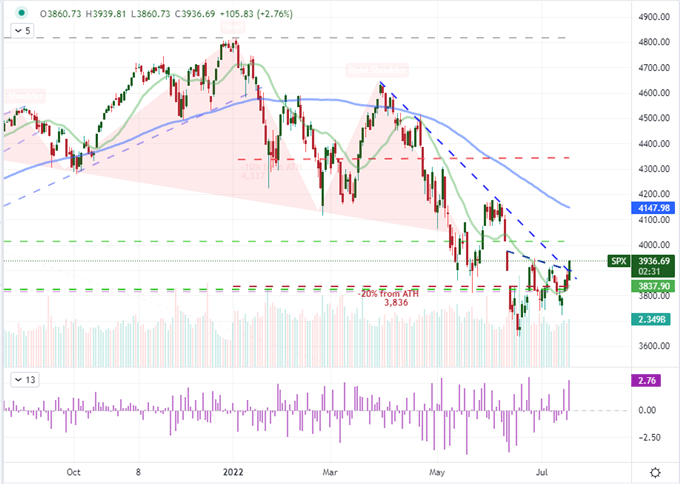
Chart Created on Tradingview Platform
When it comes to fundamental analysis, the textbooks that have trained countless financial professional are generally presented in a black and white perspective. A ‘better than expected’ outcome is bullish and ‘worse than expected’ result is bearish. Real life is far from that straightforward unfortunately. Speculation is a far more weighty influence in the market with a forward-looking bias and prioritization that has to be filtered through a crowd distorting the elementary vision of how information and reaction play out. Naturally, as the markets have progressed lower through 2022, the inevitable debate over whether the trend will carry on or find its floor happen on a daily basis. I am not a fan of picking bottoms (or tops), but they do occur. Generally, they occur when the underlying fundamentals level and turn, which can take months; or when speculative sentiment (enthusiasm or fear) is fully flushed. Catering to that later discussion, the Bank of America released its regular Fund Manager Survey with many, very interest findings. In general, the different measures suggested that the market was reflecting (through the global managers it polled) its most ‘risk off’ sentient since to 2008 – or longer in some measures. With headlines like ‘full capitulation’ referencing the data, the implication is that the market is being staged with a bottom; but ‘low’ readings can go lower.
Chart of Bank of America Polled Global Fund Managers Relative Risk Positioning
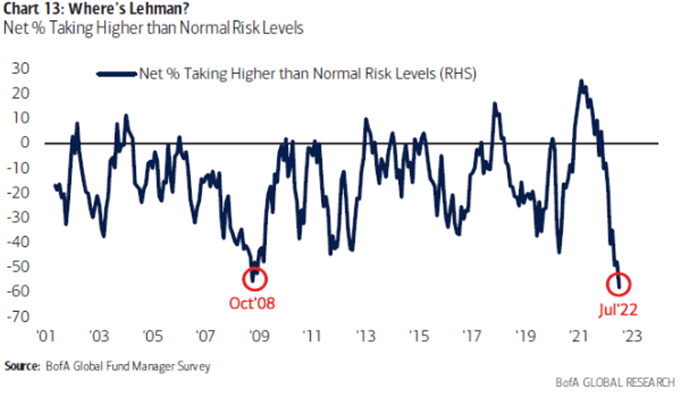
Chart by BofA Global Research from their Fund Manager Survey
Heading Into Thursday: Earnings and Then Monetary Policy
While the BoA survey is one worthy of our attention, I am not going to take the sentiment survey at face value – just as I haven’t placed my faith in consumer, business or economist polls. Nevertheless, it can factor into the bias; and a well-placed event risk and/or technical development can start to swing the pendulum. Heading into the new trading day, I am watching two fundamental matters that lead back to the dominant themes that I have been following for weeks: recession fears and monetary policy forecasts. On the former, we are still due the PMIs on Friday which will be followed by the IMF’s WEO forecast and US 2Q GDP reading next week. Yet, the more immediate growth milestone may be earnings. Remarkably, FAANG member and one-time speculative favorite Netflix (NFLX) reported earnings after hours with a strong reaction from shares after the close. This charge happened despite a miss in EPS ($2.14 vs $2.17 expected) and revenue ($7.87 billion vs $8.08 billion expected) with subscriptions dropping by 970,000. So why the initial favorable market response? The company issued a warning over the past weekend suggesting the subscriber loss could be as much as 2 million. So a ‘not as terrible as feared’ mentality has spurred a market bounce. The question is whether that is footing enough to justify a continued climb for NFLX – much less the broader market. I’ll be bringing this same sense of interpretation to the upcoming CSX, Tesla and Alcoa earnings report; but these names may also carry more weight on the macro.
Chart of the Netflix with Afterhours Trade and Volume Overlaid with QQQ ETF (8 Hour)
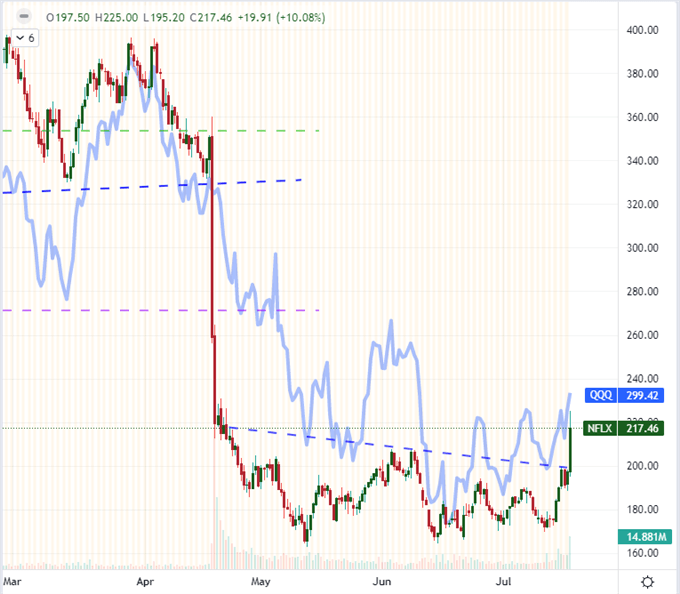
Chart Created on Tradingview Platform
Through Wednesday’s session, there may be a little competition for our interests when it comes to casting a definitive view of the market. While it leads back to economic health itself, monetary policy has been a very effective market-moving motivator in its own right. There are three high profile inflation readings on tap in Wednesday’s session. The UK consumer, factory and retail inflation figures for June will put BOE Governor Bailey’s remarks that another 50bp hike in August is not baked in to the test. The Sterling notably struggled to extend any meaningful traction after its June 16th hike. Following its own surprise 100bp rate hike last week, Canada will absorb its own June CPI with USDCAD stationed at its 50-day moving average as support. Then there is the Germany producer price index (PPI), which along with the Eurozone consumer confidence survey, will feed into anticipation for Thursday’s ECB rate decision – a policy meeting expected to end with a 25bp rate hike.
Global Calendar of Major Macro Economic Event Risk for the Next 48 Hours
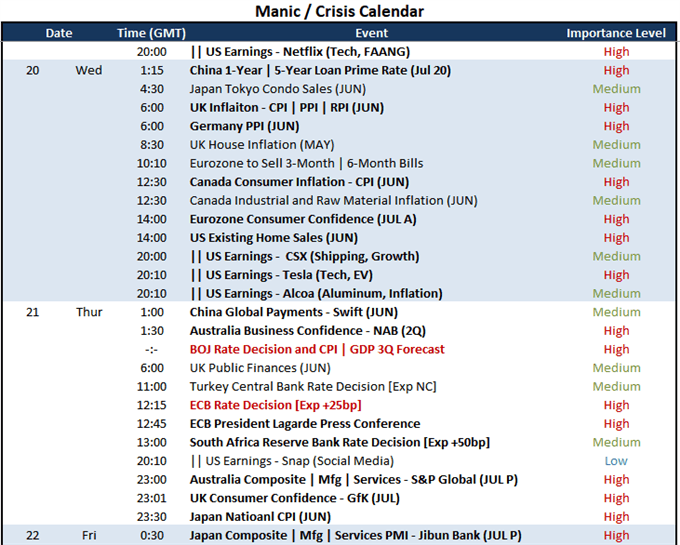
Calendar Created by John Kicklighter
When it comes to monetary policy, there is nothing definitive due to evaluate the Dollar. However, for a key player like the Greenback, there is influence to be derived from the performance of its largest peers – which the Euro and Yen are the largest. The rate forecast through the end of the year for the Fed is still among the top of its largest counterparts, but at least a significant amount of that benefit has been priced into the currency as it has risen to a two-decade high. To extend the charge, it seems that something of substance is needed to further confidence in the value ahead. In the meantime, it seems that we are seeing some moderation from the high-flying currency. Through this past session, the DXY trade-weighted Dollar Index dropped 1.8 percent over three days. That is the biggest three session slide since March 2020. As with most other markets, I don’t consider that a trend-type move; but rebalancing before critical event risk is a common occurrence.
Chart of DXY Dollar Index with 20 and 100-Day SMAs, 3-Day Rate of Change (Daily)
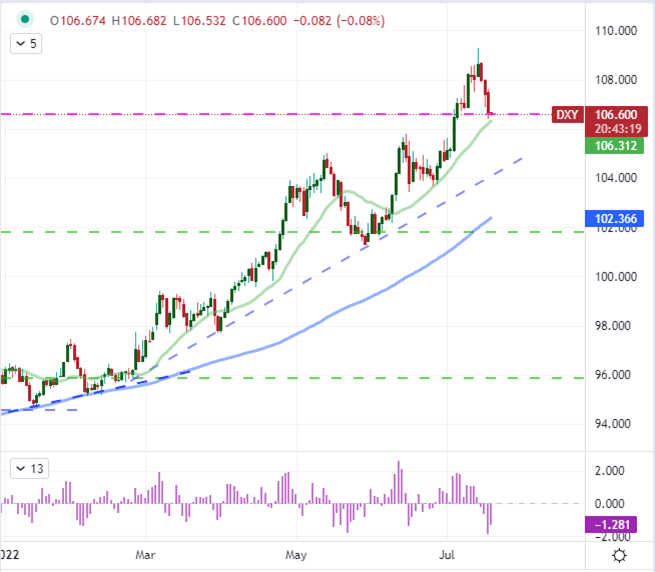
Chart Created on Tradingview Platform


