


S&P 500, FOMC, Interest Rates, Dollar, VIX and USDJPY Talking Points:
- The Trade Perspective: S&P 500 Bearish Below 4,075; USDJPY Bearish Below 134.00
- Top event risk for the coming session, week, month – and perhaps the year – is the FOMC rate decision which will weigh on much more than just today’s 50 or 75bp hike
- While the market’s general attention will hone in on the S&P 500 and Dollar, I’m more interested in the VIX and USDJPY

Markets Don’t Hide Their Focus on the Forthcoming FOMC Decision
All eyes are on the US central bank’s monetary policy decision due early afternoon in the New York session (18:00 GMT) Wednesday, and for good reason. Not only is the Fed the world’s largest central bank helming the world’s largest economy, but it is a symbolic leader for global policy that many believe has fallen far behind the rampant inflation curve. While many are worried about whether the group hikes 50 or 75 basis points (bp) later today in the New York session, there is a deeper concern for which we should keep track: whether monetary policy is losing its sway over the economy, financial system and speculative markets. At the very least, the event is still afforded the assumption of influence that has seen it dictate enormous moves from the likes of the S&P 500 and US Dollar in months and years behind us. Despite the aggressive slide from the US indices that eventually pushed the SPX through a technical barrier that has defined our current cycle as an official ‘bear market’ as of Monday, the pressure was more or less contained Tuesday. If it were not for the anticipation for the Fed, the market would have likely continued its collapse. The question is whether this is a temporary breather for fundamental momentum to regroup or an opportunity. How the Fed moves forward and the market reacts will determine our course, but it is worth noting that the S&P 500 is down 5 consecutive sessions to match its most persistent slide since February 2020 during the height of the pandemic.
Chart of S&P 500 with 20-Day SMA with Volume and Consecutive Day Moves (Daily)
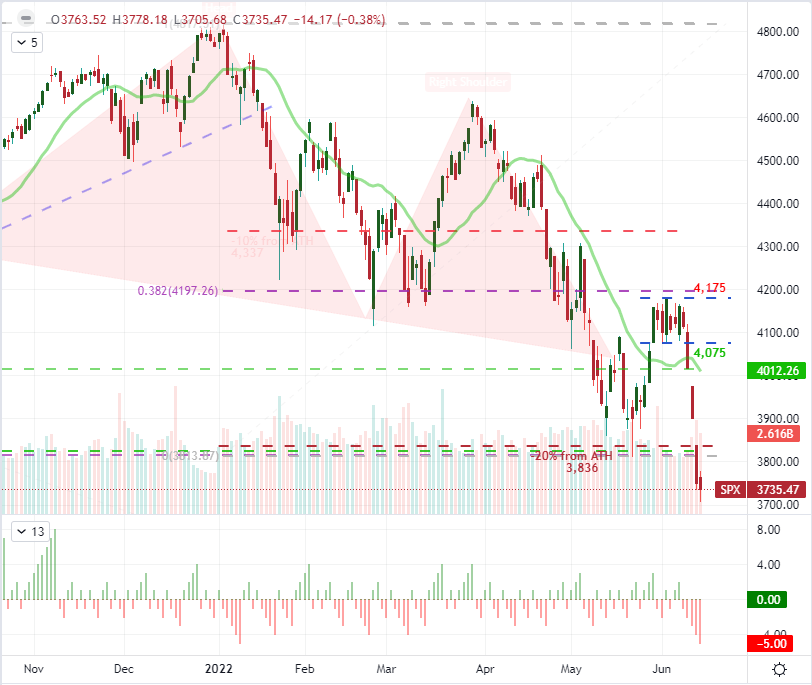
Chart Created on Tradingview Platform
The Scenario Breakdown of a Critical Monetary Policy Decision for the World
Rate expectations for this particular Fed meeting has exploded just over the past few trading days. Just a week ago, the prevailing forecasts for this policy event was a hawkish but well-messaged 50 basis point hike and progress into the a measured quantitative tightening effort. Yet, in the absence of central bank guidance from rhetoric due to the media blackout, the combination of extreme inflation via the CPI and the collapse in a US consumer sentiment report has charged speculation of a wide range of possible outcomes form this policy group. When there is a wide range of probable results from a such an important event, there is a much greater probability of a significant market impact regardless of the outcome. Breaking the Wednesday policy event down, there are generally two separate collision times: the rate decision and Summary of Economic Projections (SEP) are due at 18:00 GMT, while Chairman Powell’s press conference starts half an hour later. I believe the first wave is more important; but depending on how it plays out, the Chairman could find himself in a position to add fuel to a raging fire.
Table of FOMC Policy Decision Scenarios and Market Response

Chart Created by John Kicklighter
There are a few factors into gauging a major fundamental event’s ultimate impact on a market. While many traders tend to follow a text book ‘A is better for a market while B is negative’, there are critical complications that we are dealing with heading into this event. The first criteria is the starting point from previous policy bearings. At the March 16th FOMC meeting, the central bank not only hiked its benchmark range by 25 basis points; it further upgraded its forecasted pace of tightening through 2022 by 100 basis points. It is very likely that they significantly increase this projection once again at this meeting. After Friday’s CPI reading made clear that inflation was not transitory – and it hasn’t even peaked – the need to curb the pressures to ensure it doesn’t stall economic activity swelled. In particular, I’m interested to see what their median rate forecast is; but it is important to keep tabs on their outlook for growth, inflation and unemployment as well.
Table of Fed Growth, Unemployment, Inflation and Interest Rate Forecasts from March

Table from FOMC March 16th Summary of Economic Projections
Measuring the change in the policy authority’s own expectations is an important assessment to gauge the market’s response to the actual event; but to really ground the scenarios for a price response, it is essential to determine what would surprise the markets themselves. As previously suggested, the range of expectations is distributed broadly enough that any outcome would likely catch a significant portion of the market off guard. In the back-to-back polls I conducted on Twitter around policy scenarios and market response, we can readily see a fairly even distribution of possible outcomes on the policy mix (with the exception of a 100bp hike). What’s more, there is just as much dispute among traders as to what policy mix would best serve the troubles S&P 500. Beware the market response in this environment.
Twitter Polls Asking Traders the FOMC Decision and the Best Scenario for a Bullish Market Response
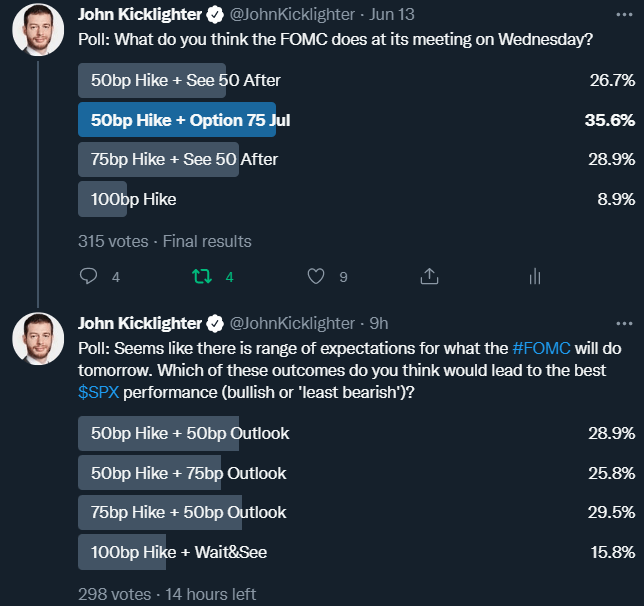
Poll from twitter.com, @JohnKicklighter
My Top Two Markets to Watch for Wednesday: VIX and USDJPY
I’m sure that traders in all markets are tuned into the Fed decision, expecting the event to represent a source of enormous volatility potential even if the there are many degrees of separation between their asset and the event. While the US policy mix doesn’t directly represent a systemic opportunity for directing anything and everything, its influence should not be underestimated given its implications for the global financial system. How heavy the ‘risk trend’ impact is depends on the outcome and the course of catalyzing speculative interests, but I will be looking to a specific benchmark to gauge whether the there is a short-term rebound opportunity in risk, a steady extension of 2022’s bear market or a plunge that snuffs out the bearish fears faster than previously expected. The VIX volatility index is a flawed measure of ‘fear’ or ‘risk’, but it is still useful in its capacity to evaluate hedging and speculative appetites. Should the VIX continue to rise slowly amid even a significant slide in the underlying S&P 500, I don’t believe there will be a viable contrarian read to draw unless there is a sudden and holistic reversal in underlying fundamentals. Yet, a surge above the 50 market may draw out all the fear in one fell swoop, opening up the door to reasonable opportunism.
Chart of VIX Overlaid by the VVIX (Weekly)
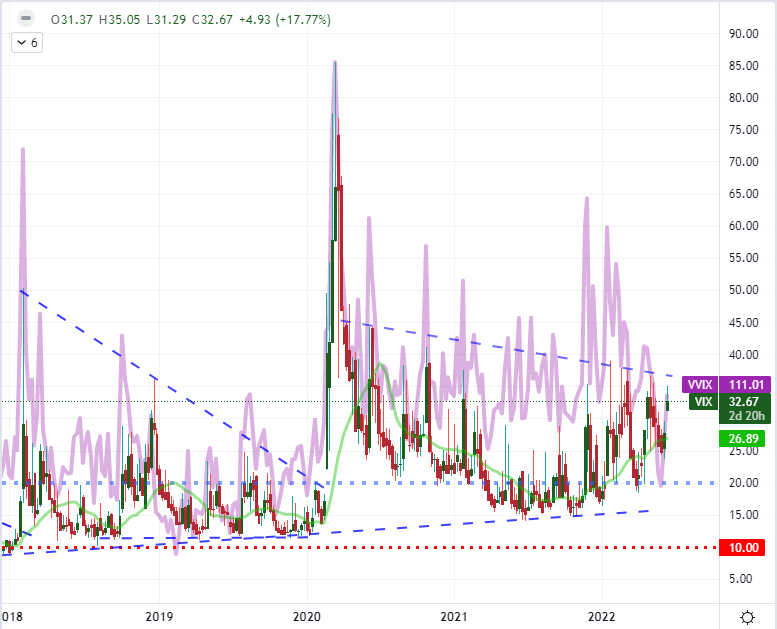
Chart Created on Tradingview Platform
When it comes to the market impact of the Fed decision or any other major event risk, the target asset’s staging heading into the spark matters just as much as the outcome of the report/remarks. As such, USDJPY has put itself into a position to trigger serious fallout from the Fed decision. The prevailing bull trend has pushed the pair to overtake the previous 135.16 swing high from January 2002 and notch an 8-day rally in the process. That bull run matches the longest stretch for the benchmark cross going back to 2011. I don’t believe markets haveto reversal, but the conditions can layout a higher potential. Given this pairs conflict between the appeal of aggressive US rate forecasts and the swoon in risk trends of late, this looks like a fraught instability and elevated perch from which to fall from. It is absolutely that the outcome of the Fed decision could help generate a ‘risk’ rally or further Dollar charge, but I would be dubious of follow through almost immediately. Alternatively, a firm push into a bearish reversal would trigger a number of dominos all at once.

Chart of USDJPY with 20-Day SMA and Consecutive Candle (Daily)

Chart Created on Tradingview Platform


