


S&P 500, Volatility, Liquidity, Dollar, EURUSD and USDJPY Talking Points
- The Trade Perspective: S&P 500 Bearish Below 4,000; GBPCAD Bullish Above 1.6000; EURUSD Bullish Above 1.0650
- The S&P 500 is holding steadfast above its technical ‘bear market’ threshold, but unrelenting volatility seen in ‘wicks’ creates problems with liquidity thinning
- Growth data has slowed via May PMIs, but forecasts remain the point of market impact with rate forecasts controlling the course – as with the Dollar’s slide

A Tenuous Hold Above an Official Bear Market
The clock is ticking as the hours of liquid trading before a long, holiday weekend dwindle. The opportunity for attempting any serious trend development are in turn fading, but that doesn’t write off potentially critical breaks. Further, the likelihood of disruptive volatility amid active fundamental themes against these thinly traded conditions is more likely the rule, rather than the exception. My litmus test for how serious the situation in risk appetite is will remain the S&P 500’s proximity to 3,830 – the official 20 percent correction from all-time highs. This past session, there wasn’t a serious effort to dive back towards that tipping point; but the activity behind the markets raises red flags for stability concerns. While the benchmark US index fought off a more significant slide, the hallmarks of the pressure are left in the charts. In addition to the 20-day ATR, which offers realized volatility; the size of the lower ‘wicks’ we have seen over these past weeks and months suggests bulls are having to mount a serious effort to hold back the tide. It is impressive that we have managed to hold back a more productive tumble, but how long can opportunism fend off seemingly relentless pressure?
Chart of S&P 500 with 20-Day SMA, Daily ‘Wicks’ and 20-Day ATR (Daily)
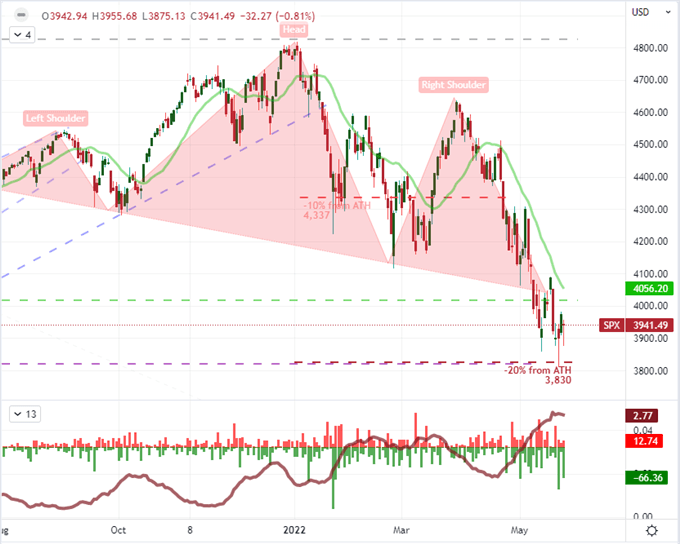
Chart Created on Tradingview Platform
It is only Wednesday, but we can already see the direct hallmarks of thinned liquidity. The more traditional measure of activity in the regular capital markets is volume. The 91.5 million shares in turnover from the SPDR S&P 500 ETF and 1.98 million contracts in emini futures this past session is low relative to the volatility we have seen in the underlying market, but certainly not a record of any sort. I am more interested in another measure of derivative participation in open interest from the aforementioned futures contract. Even adjusting for the ‘seasonal’ element of expiration, we have seen exposure to this this most heavily traded ‘market’ benchmark drop to levels comparable to 2008. I’m not suggesting we are in the same position now that we were heading into the Great Financial Crisis, but there is a backdrop of rising interest rates, warnings of growth struggles and a sense of excessive exposure that far outstrips anything that we had experienced leading into that crisis.
Chart of VIX Volatility Index Overlaid with S&P 500 Open Interest (Daily)
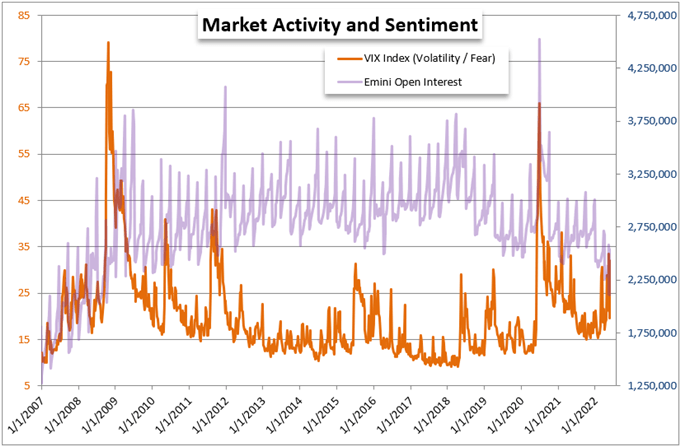
Chart Created by John Kicklighter with Data from Bloomerg
Economic Activity Hasn’t Stalled Yet, But the Throttle is Fueling the Imagination
Are we going to see a ‘soft landing’ for the US and other major economies where central banks are pursuing monetary policy strategies aimed at containing inflation pressures? That should be a top concern for traders and investors alike, because the ‘buy the dip’ mentality would not likely hold back the tumble motivated by confirmation that the economies are not just slowing in the face of restrictive policy, but actually contracting. Thus far, we relegate that threat to speculation. This past session, we were offered up the May PMIs from S&P Global (formerly produced by Markit), and the general timbre of the data was unflattering. That said, it held above 50.0; so there was still a measurable expansion. That said, if we track the slowing from April to May out against the developments that we are tracking in the headlines, there is a distinct risk that more than a couple of the G7 economies are at risk of at least a month of contraction in 2022. As I’ve warned before, if the consensus (in the market) catches wind that the Fed and other monetary policy officials are willing to let their economies contract for a period – as some have explicitly warned – to combat inflation; it would not be far-fetched at all to expect official bear markets from peaks scaled only because of extreme stimulus backing exuberant risk taking.
Chart of Composite PMIs for Major Developed Economies and China (Monthly)
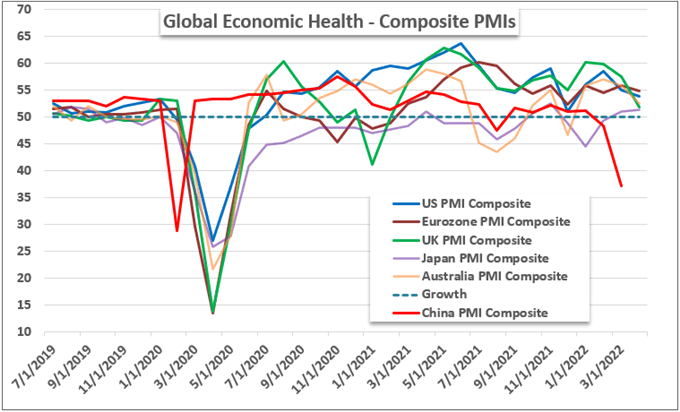
Chart Created on trends.google.com
It will be some time before we see another run of data with the same clout as the PMIs for a global reflection of economic activity or a singular event that can stand in with the scale of impact as a developed world quarterly GDP update. As such, we will find our ups and downs fostered through speculation. There is plenty of ‘medium’ level event risk on the docket going forward, but how the collective speculative view interprets the data will depend heavily on the expectation for offset from policymakers. As it stands, the central banks are trying to signal clearly that they generally will not act as the eager parent looking to sooth market participants’ every minor pain. That recognition is sinking in through US benchmark. The US 2-year Treasury yield (a strong proxy for the ‘medium term’ Fed rate forecast) finally broke lower this past session which happens to align to the DXY Dollar Index’s extended retreat. The biggest two-day slide in month from the Greenback puts its into immediate pressure with the 61.8 percent Fibonacci retracement of the past two-decade range.
DXY Dollar Index with 50-Day SMA Overlaid with US 2-Year Treasury Yield (Daily)
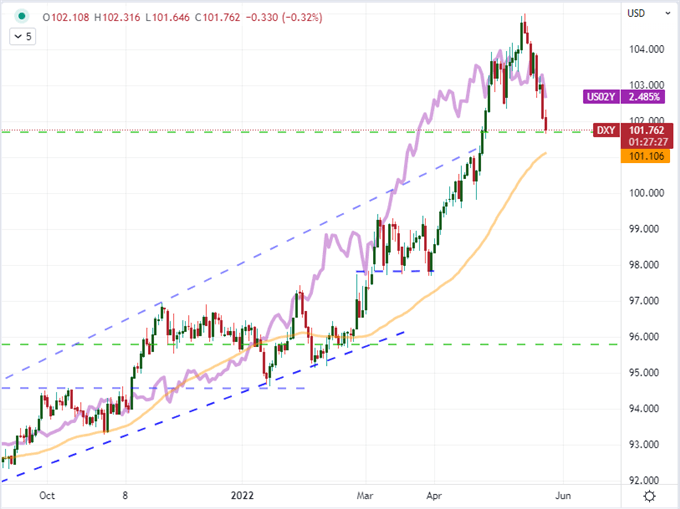
Chart Created by John Kicklighter
The Pairs to Watch for Risk Trends and Rate Forecasts
Market conditions are conducive to volatility, but the more measurable variable moving forward for volatility is the scheduled event risk on tap. In general, I am very interested in the evolution of interest rate expectations because it is a daily evolution and there are measures to track the markets perception. It is worth nothing that Fed Fund futures reflected a sharp downgrade in the probability of a 50 basis point rate hike in September. That may seem over the horizon; but an extended clip of half percent increases from May’s meeting through September (four meetings for 2.00 percentage points) is the feasible definition of a hawkish pace. We’ve seen the spread between US and Japanese 2-year yields slip larger on the former’s development, but I like USDJPY for multiple scenarios. It is possible that the Japanese central bank forecast finally gives hope for a rate hike in the future; but risk aversion is perhaps the most loaded opportunity to trigger a serious move for this pair and all Yen crosses that I see.

Chart of USDJPY with 50-Day SMA and Overlaid with US-Japan 2-Year Yield Differential (Daily)
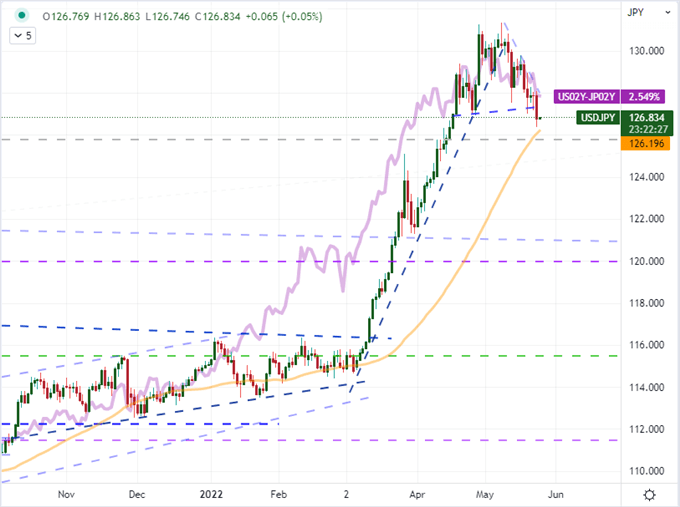
Chart Created on Tradingview Platform
If you are looking to fully remove yourself from the influence of ‘risk trends’, you have a difficult to ask at hand. There is some measure of safe haven relative to risk asset in all pairings for the FX market, but there are certainly pairs that reduce that consideration. On the one extreme, you have NZDJPY which pits a ‘major’ that is included largely due to its history of high yield against a AAA rated sovereign debt (New Zealand Dollar) against a multi-decade ‘funding currency’. Pairs like USDCAD and EURCHF help to reduce the influence of risk trends, but there is still a meaningful influence here. AUDNZD is one pair where I consider the relative potential of yield versus safety to be largely balanced. That said, the RBNZ’s pursuit of an aggressive policy tightening regime has nevertheless seen the Kiwi slide in value. I believe the retreat is too aggressive versus the Aussie Dollar, Canadian Dollar and Pound among others. Keep an eye on those pairs.
Chart of AUDNZD Overlaid with Australia-New Zealand 2-Year Yield Differential (Daily)
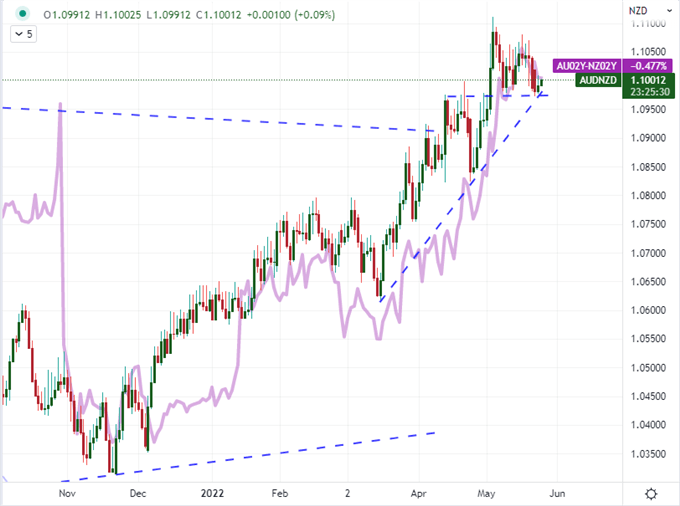
Chart Created on Tradingview Platform


