
S&P 500, Nasdaq 100, Dollar, EURUSD and USDMXN Talking Points
- The Trade Perspective: S&P 500 Bearish Below 4,000; AUDJPY Bearish Below 90; EURUSD Bullish Above 1.0650
- Another effort to mount a recovery by the S&P 500 and Nasdaq 100 – among other ‘risk assets’ – fell apart through the US session, leaving us ultimately worse off
- Rate speculation remains a driving fundamental theme with the slight ease in US CPI not offering true relief, but it may be enough to nudge EURUSD into a turn

The Beatings Will Continue Until Morale Improves
There is a pattern emerging, specifically during the US trading session, that sees nascent efforts to muster a recovery rally fall apart. This can happen perhaps once or twice without developing a permanent scar on investor sentiment, but there have been numerous iterations of this troubling ‘false start and collapse’ just int eh past week. We are risking a lasting and prevailing sense of fear that dictates the overriding bias of the market. For the time being, the damage just this past session was onerous enough. A tentative pop through the opening hours of New York session trade for the major US indices stretched out the possibility of traction just a little further than what we had seen the day before. That said, confidence ultimately ended in the same dismal spiral at the end of the day. Taking stock of the performance, my preferred ‘imperfect’ measures of sentiment, the S&P 500, rose as much as 1.2 percent from Tuesday’s close, but the effort ultimately collapsed to end the day with an overall -1.7 percent loss over the previous trading session. That would ultimately lead the index to a fresh 14 month low and put us within 2.8 percent of a technical ‘bear market’ (defined as a 20 percent correction from systemic highs).
Chart of S&P 500 with 20-Day SMA, 20-Day ATR and ‘Wicks’ (Daily)
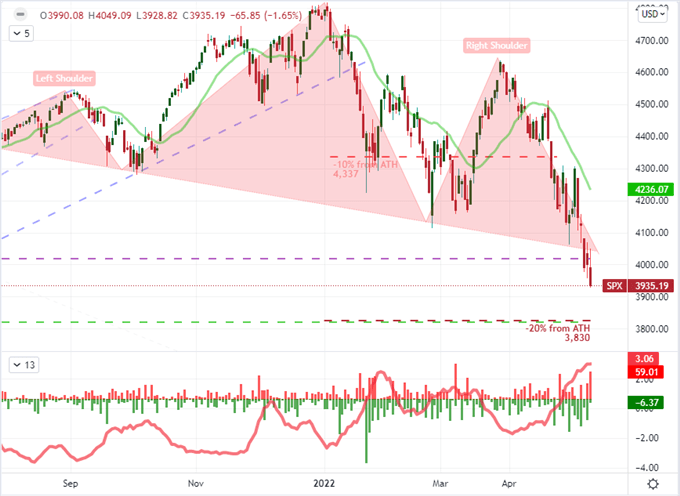
Chart Created on Tradingview Platform
In a notably more vulnerable position, the Nasdaq 100 was characteristically registering a steeper loss on the day. Through Wednesday’s close, the tech-heavy index dropped another -3.1 percent. Relative to the ‘value’ based Dow Jones Industrial Average, the ‘growth’ index furthered its slide from its Dot-com boom/bust record highest back on December 1st. That speaks to the topple in confidence from the once-top performing corners of the market. In more general terms, the Nasdaq 100 is on pace for a -5.7 percent loss on the week – which is already the second worst showing in a week since the pandemic, two days before we close the books. For tempo, this is on pace for the sixth consecutive week of losses for this index which is the longest tumble since November of 2012. And, for general reference, we are close to retracing half of the post-pandemic rally from March 2020 to November 2021, at 11,768. Keep tabs on this unflattering benchmark.
Chart of Nasdaq 100 with 20-Week Moving Average and Consecutive Candle Count (Weekly)
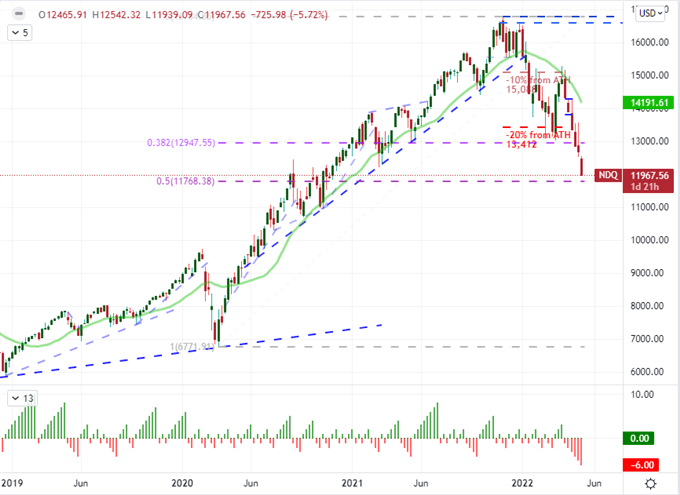
Chart Created on Tradingview Platform
Monetary Policy Concerns Continue to Drive the Ship
As far as fundamental motivation goes, it seems that monetary policy and its principal provocateur (inflation) continue to drive markets along. This past session’s top billing was US consumer inflation for April. Initially, the step down in both headline and core inflation from the March’s multi-decade highs fed into the growing speculation amongst the optimists that the extreme swell in prices has peaked. That said, the modest slip in the headline (to. 8.3 percent) and core inflation (to 6.2 percent) was smaller than was expected. More importantly, it is hardly any relief at all in practical terms. That said, it doesn’t come as much surprise that capital market’s relief was fleeting, but there was a little more of a breather for yields and the Dollar. This data does very little to put off the forecast given by the FOMC itself for 50 bp hikes in June and July and 25 bp moves to close out the year. On the other hand, it may soften the argument for a 75 bp hike anytime this year or 50 bp moves beyond July. Keeping tabs on the DXY Dollar Index, the crawl to register fresh 19 year highs continues, but there is little progress being made.
Chart of the DXY Dollar Index with 20-Week Moving Average Overlaid with US 20-Year Yield (Weekly)
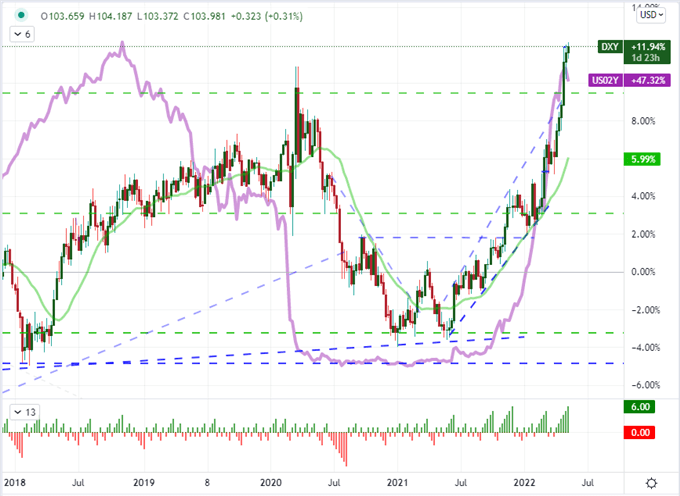
Chart Created by John Kicklighter
In general, I see the Dollar as a prone currency. To establish an extended period of congestion while pushing near two-decade highs deserves serious scrutiny. Seeing a sudden stall in tempo alongside strict consolidation is unusual – more often there are corrections even in prevailing trends. As such, I consider the breakout risk from this congestion to be particularly high. Finding an outlet for that view should take into consideration counterparts. There is a good case to be made for USDJPY but that is more of a ‘risk’ factor while GBPUSD should draw from the Sterling’s event risk ahead. EURUSD is a more immediate candidate on the basis of monetary policy. An extremely narrow, 9-day range looks like an acute breakout risk as the pair is on the verge of its own multi-decade lows around 1.0400/0350. It would seem natural that the ‘hawkish Fed’ and ‘dovish ECB’ set the course, but there is a lot of contrast already priced into this cross. This past session, ECB President Lagarde seemed to solidify expectations for the first hike from her group in years as early as July. While it won’t close the gap materially to the Fed’s hawkish tempo, it starts to turn expectations of a relentless deviation. Keep an eye on 1.0635.
Chart of EURUSD with 20 and 100-Day SMAs, 8-Day Range and 8-Day ATR (Daily)
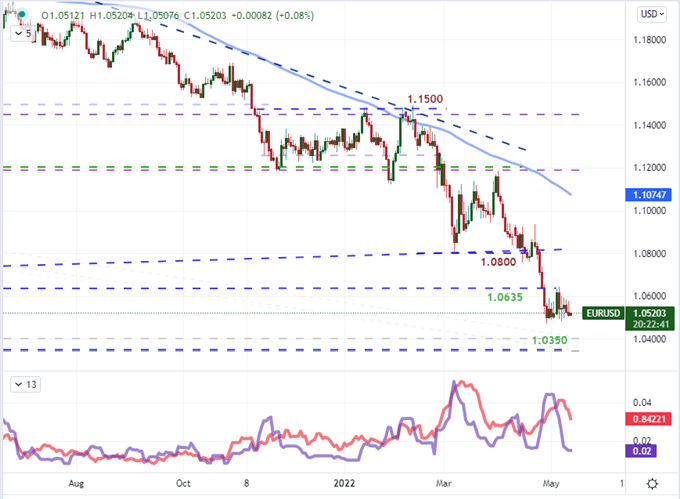
Chart Created on Tradingview Platform
Top Event Risk Ahead: US PPI, UK GDP and Mexico’s Rate Decision
As far as top tier event risk, the last 48 hours of the trading week don’t offer up a big list of concentrated market movers. That said, there are some legitimate sparks that fundamental traders should watch. Speaking to US monetary policy, we will follow up Wednesday’s CPI release with the upstream producer inflation (PPI) update for last month at 12:30 GMT. If this data does not echo – or extend – the relief suggested by the consumer report, it would not be surprising to see the more aggressive views of Fed rate speculation pick up once again. If we are looking for a more concentrated round of event risk, the UK data due for release will carry significant weight. While I am watching industrial production, trade balance and construction activity; my principal focus is on GDP for March and 1Q. After the BOE’s own warning that growth may actually contract by year’s end, the NIESR April GDP forecast may be the top listing overall. It will be worthwhile to see what this data does in traditional fundamental valuation as well as feed into rate speculation.
Calendar of Major Economic Events
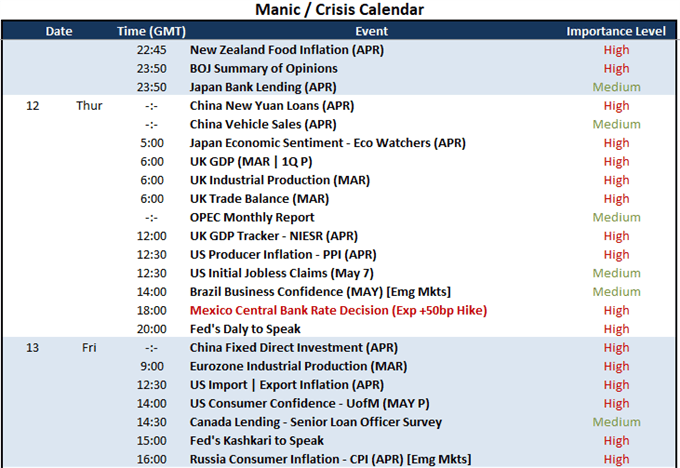
Calendar Created by John Kicklighter
Speaking of rate speculation, the most pointed update from the top theme that I’m monitoring (monetary policy) is the Mexican central bank rate decision. Following on heels of the Fed’s half-a-percent rate hike last week, its southern neighbor is expected to raise its own benchmark by 50 bps. That would not exactly be out of character for this group and not a surprise given the attachment to the United States. That said, the contrasts that can be derived from this monetary and economic relationship may speak to how other countries with ties to the world’s largest player will respond to its aggressive acceleration.
Chart of USDMXN with 200-Day SMA (Daily)
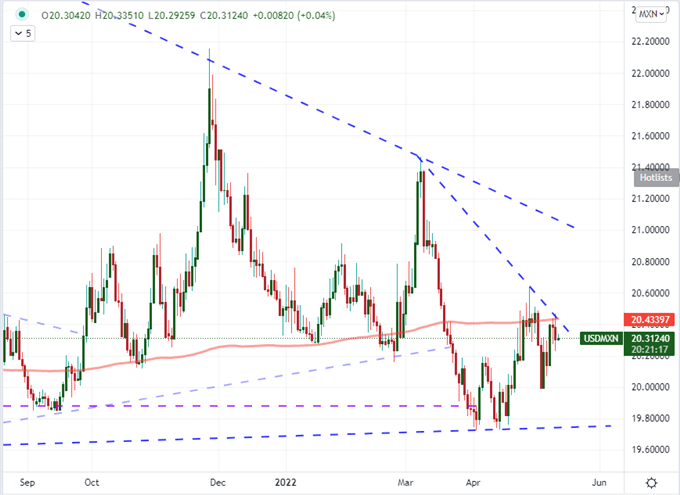
Chart Created on Tradingview Platform