

S&P 500, Dollar, GBPUSD and Monetary Policy Talking Points
- The Trade Perspective: S&P 500 Bearish Below 4,000; AUDJPY Bearish Below 90; EURUSD Bullish Above 1.0650
- A collapse in ‘risk assets’ stalled this past session, but the bullish gap for the Nasdaq 100 and S&P 500 hardly made a greater impression than the persistent volatility
- Top fundamental spark to track over the coming session is the US CPI release which may Fed rate speculation for equity movement…or an overdue Dollar breakout

An Uneasy Check for Risk Assets – Trend Versus Counter Trend
If you still read the financial newspapers – and I don’t think many retail traders still do – the headline of a 1.2 percent Nasdaq 100 advance and S&P 500 0.3 percent gain would have stood out. That is because the cumulative pain over the previous three days has been nothing short of painful. Yet, the context to this bounce is far less than flattering. On the fundamental side, there is nothing really presenting an underappreciated view on battered risk assets; but the downgraded forecasts for growth and constant reiteration for a tightening cycle that will not be put off course certainly paints a picture. In pure price action, the Nasdaq 100 managed to earn a 1.2 percent gain this past session while the S&P 500 notched its own 0.3 percent gain. In both cases, we have hardly offset the losses of the past week. What’s more the persistence of volatility (implied and realized) does not bode well for the resolution to a tentative reversal picture. The S&P 500 earned a hearty gap to the upside on the open for example, but the volatility on the day does little to validate a true reversal.
Chart of S&P 500 with 1-Day Rate of Change and 10-Day ATR (Daily)
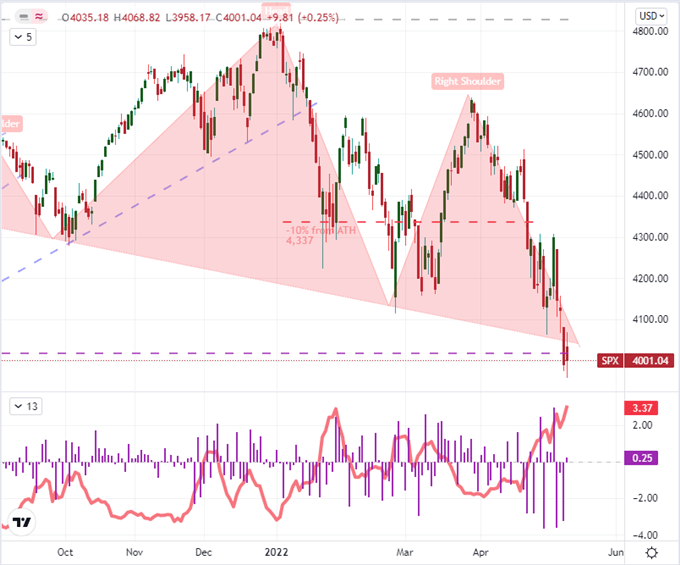
Chart Created on Tradingview Platform
I don’t take the suggestion of a general reversal in a benchmark risk assets lightly. Navigating the markets is a function of assessing probabilities and outcomes related to the different top themes. When it comes to risk trends via the more traditional channels, the US and global major measures seem important points of sentiment overriding even internal considerations. Outside of the macro view of monetary policy – which will be teased by the US CPI release- there isn’t much in the way of systemic throttle boosters. In the meantime, the once-highflying crypto area of the market seems to be falling hand-in-hand with other struggling assets. For the NDX and SPX, Tuesday opened to a major gap higher, but the sheer lack of follow through should raise serious concerns. In overview, the S&P 500 may have slowed its tempo as a cliff diver, but a stall doesn’t translate into meaningful gains.
Chart of Coinbase Stock Price with 20-Day Moving Average and 1-Day Rate of Change (Daily)
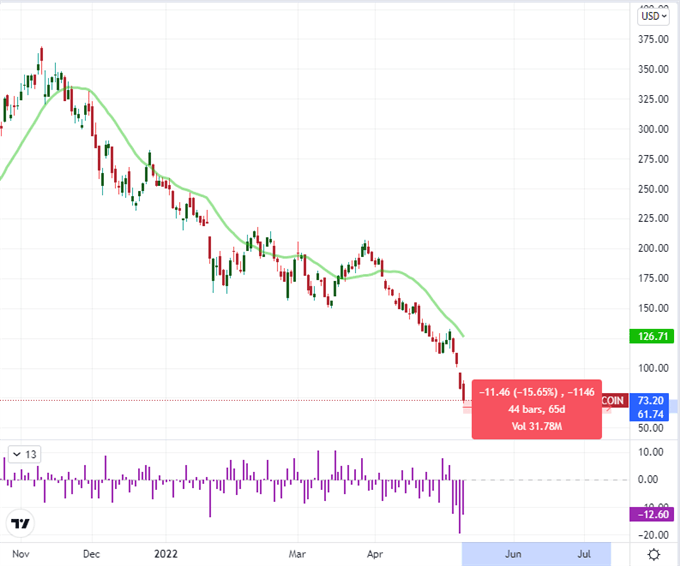
Chart Created on Tradingview Platform
What’s Driving Markets?
It’s a simple enough question: but what motivates the next leg of a sustained ‘risk’ asset tumble or motivates the reversal that fully overrides the buy-the-dip crowd’. We have seen some interesting sentiment considerations this past week, but it’s important to gauge the reach and longevity of the development. Earnings for example seems to be a narrow set in its own right. This past session included a release of earnings from once-well regarded speculative players. We have left the major finance institutions and top market-cap players in our collective wake, but there are still speculatively-oriented focal points that should be monitored. Consider the once, high-flying meme stocks of the past year are now taking severe body blows for their underwhelming performance – and you start to get a sense of how markets are likely to react to headlines. Consider, the beat for AMC Monday with an eventual slide. Meanwhile, Peloton and Coinbase have both outright missed the official conensus. So how to do we realized a resolution strategy.
Chart of EIA Average Retail Gasoline Price and NY Fed 1-Year Consumer Gas Price Forecast (Monthly)
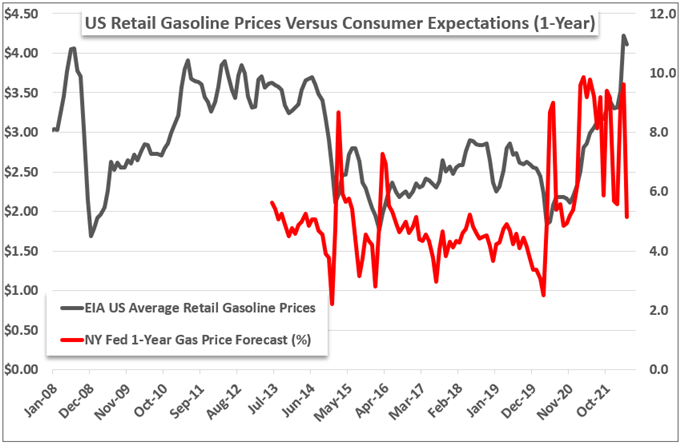
Chart Created by John Kicklighter
For a more active and effective theme to guide going forward, monetary policy is a top risk trend provocation. It is not a stretch to say at this juncture that inflation is perhaps the most pernicious aspect of the fundamental landscape to fully price in. After the Fed’s first 50 basis point cut in 22 years last week, there will be a hypervigilance to the data that will weigh into the various FOMC officials’ calculation for monetary policy moving forward. The US CPI – with April data due to day – is the market’s favorite inflation indicator compared to the Fed’s preferred PCE deflator. That said, the market is in the driver’s seat with projecting rate pricing. The inflation figure for last month is expected to reflect a step down from the multi-decade high registered in Marc, but that is unlikely to feed the near desperate ‘but the dip’ mentality floating around these markets..
Chart of US CPI All Products Year-Over-Year Change (Monthly
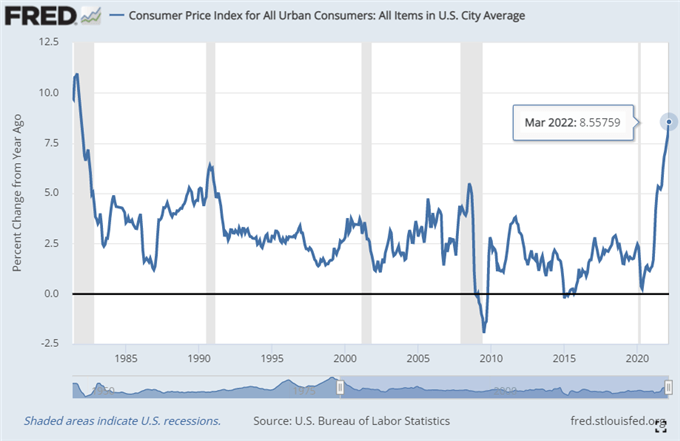
Chart Created on Federal Reserve Economic Database
A Dollar Breakout and Other Notable Updates
While risk-leaning benchmarks like the US indices are top of mind for the shape of sentiment and the pressure on monetary policy trends, the more immediate future presents a case of technical dislocation. Higher interest rate expectations not only motivate the top global assets, but they can redefine sentiment. In the meantime, the Dollar remains incredibly stoic through some of the heaviest intraday market mentions and measures. I will be looking for a break from EURUSD after 8 days of uncharacteristic breakout, but remember the backdrop for confidence.
Chart of EURUSD with 20 and 100-Day SMAs, 8-Day Range and 8-Day ATR (Daily)
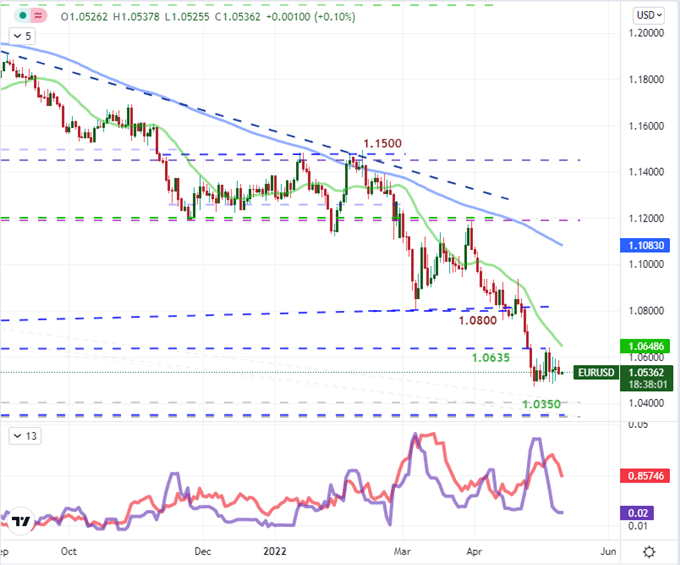
Chart Created on Tradingview Platform
Finally, we end this update with a look on monetary policy and other systemic matters. While there are numerous matters of interest at the momentum, I will continue to focus on events that I believe could stir the deepest wells of our sentiment. The US CPI is an obvious top billing against the burgeoning monetary policy focus. That said, there is other fundamental fodder on top. Chinese inflation, ECB President Lagarde’s speech and earnings are just a few additional complications. Not only am I watching EURUSD and Chinese inflation data; but there are some serious biases to extrapolate. While US inflation can certainly blow expectations away – which would cut offers modest boot to the Dollar – it is not going to survive the train accident..
Calendar of Major Economic Events
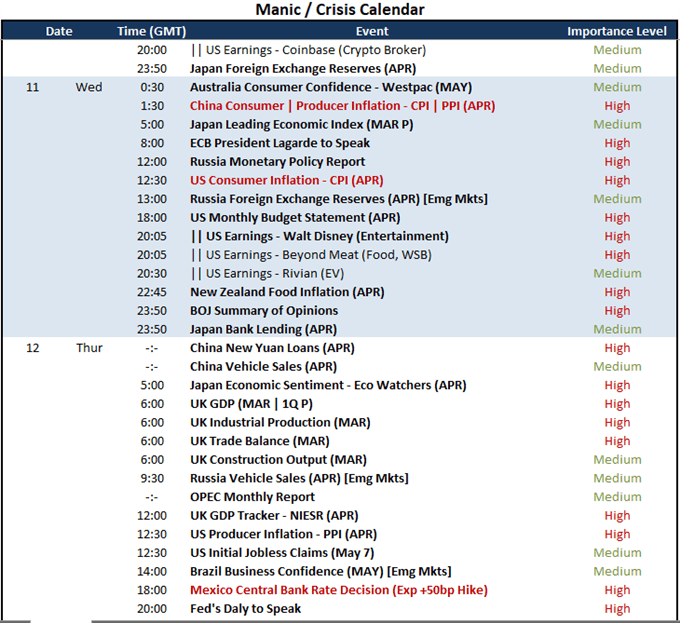
Calendar Created by John Kicklighter