Nasdaq 100, FAANG, Dollar, Yields and USDCNH Talking Points
- The Trade Perspective: S&P 500 Bearish Below 4,375; USDJPY Bearish Below 126
- The tech-centric Nasdaq 100 has returned to a technical ‘bear market’ before the core FAANG members are due to report their earnings in the week ahead
- With the FOMC decision due on May 4th, the central bank is in its media blackout; which will amplify the influence of GDP, Russian and financial concerns


A Serious Slide to Close The Week
For more than a week, the benchmark US indices were checking back and forth in a well-established range that could entertain potential for both unrelenting bulls and ambitious bears. Yet, those technical boundaries were clearly broken through the end of this past week in a charged collapse through support form the S&P 500 to the Dow Jones Industrial Average to the Nasdaq 100. Beyond the mere range clearance, the tech-heavy Nasdaq 100 would return to its unflattering designation of a technical ‘bear market’. The statistical milestone for this moniker is a 20 percent correction from all-time highs – not a small price development. This may seem like a technical milestone, but consider the headlines it will generate in the broader market. The greater the awareness of bearish progression to market participants that would otherwise not consult a chart on a regular basis, the more corrosive the backdrop. Add to that technical backdrop the unstable fundamental environment where growth forecasts are eroding, rate forecasts continue to grow and Russia remains an unpredictable systemic threat; and we are facing an unfavorable outlook.
Chart of Nasdaq 100 with 20 and 100-Day SMAs and 1-Day ROC (Daily)

Chart Created on Tradingview Platform
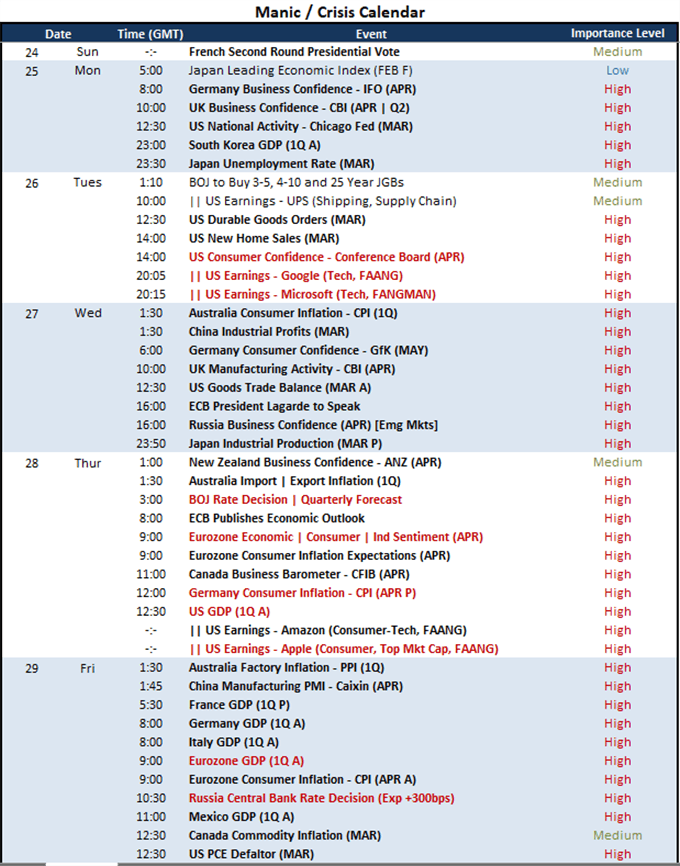
To project a picture of the ‘risk’ spectrum over the coming week, there are a range of fundamental themes to monitor and various market measures that are worthy of a close follow for systemic assessment. That said, considering the deeper slump from the tech-heavy Nasdaq 100, I will be particularly interested in the earnings calendar through the coming week. This past week, Tesla’s better-than-expected report was the one of the best hopes for charging the ‘buy the dip’ mentality, but the opportunity collapsed spectacularly – arguably even feeding into the selloff that we had experienced through Friday. In the week ahead, we are due the bulk of the vaunted FAANG members’ earnings updates – Netflix already fell significantly short of consensus this past week. Whether you are watching the equity or macro implications, Tuesday will offer up Google and Microsoft figures after hours; Wednesday will focus on Facebook; and Thursday brings the potent combination of Amazon and Apple. These figures could start a bearish – or bullish – avalanche from the top of the speculative mountain, but the sheer impact of their market capitalization is worthy of our attention.
Chart of FAANG 6-Month Performance (Daily)

Chart Created by John Kicklighter
The Macro Measures to Watch Most Closely
If you are watching the economic docket, the week ahead is loaded with high-touch event risk. The tech-centric earnings run is certainly an area to focus in on – but it isn’t the only theme of consequence. Another prominent area of macro release is the run of growth-related statistics. While that includes monthly figures such as retail sales reports and sentiment surveys, the official 1Q GDP numbers from the US and Eurozone will likely draw more than their fare share of headline space. And, when the markets are more aware, there tends to be greater market redirection. For outsized, one-off risks, I would suggest keeping close tabs on the French election. While incumbent Emmanuel Macron is expected to retain the Presidency, a win by far-right Marine Le Pen could represent an outsized risks to Europe’s unified position with regards to Russia. Another area of interest will be on monetary policy – one of the most persistent driving forces of 2022. We are due both an update from the Bank of Japan (one of the most persistent doves of the developed world) and the Russian Central Bank (struggling to weather the severe sanctions from the West).
Calendar of Major Economic Events

Calendar Created by John Kicklighter
One central bank that is not due to offer desperately-desired rate update is the Federal Reserve. The world’s largest central bank has entered its pre-FOMC meeting media blackout as of Saturday, and now the countdown to the May 4th policy update has started in earnest. Over the past few weeks, policymakers have made a very overt effort to foster expectations of steady rate hikes (with a two or three 50 bps increases in the front end) as well as a controversially faster tempo of quantitative tightening. The Dollar has capitalized on the hawkish forecasts with a push to highest not seen since the height of the pandemic crisis back in March 2020. That reference in mind, perhaps the Greenback is drawing on both its interest rate potential as well as its safety appeal. If we are weighted more towards the former, the absence of updates from official Fed members will likely see some moderation in exposure, but Friday’s PCE deflator (the FOMC’s preferred inflation reading) will offer some important insight.
Chart of DXY Dollar Index with 20 and 100-Day SMAs, 1-Day ROC (Daily)

Chart Created on Tradingview Platform
More Targeted Threats to Monitor Moving Forward
While we have official 1Q GDP figures due from the United States and key European members over the coming week, I think there is more serious concern to be found through timely statistics. This past week, the IMF downgraded global and key player growth forecasts significantly. That carries very serious weight – even if the markets were slow to account for the threat. For more advanced fundamental risk, it is worth keeping tabs on the recession risks posed to Japan’s economy as its currency collapses; Europe’s risks of economic retrenchment amid Russian sanctions (the Bundesbank warned cutting off German from the country’s imports would lead to recession); and the US Treasury yield curve. While the unwind of zero interest rates and the massive stimulus program from the US central bank is exacting a serious impact on the ‘2-10 curve’, there can be a relevant economic reading in this measure even if not driven principally from growth potential. The curve had already ‘inverted at the start of the month; but a return to negative territory would significantly exacerbate the situation.
Chart of US 10-Year to 2-Year Yield Spread with 20 and 100-Day SMAs (Daily)

Chart Created on Tradingview Platform
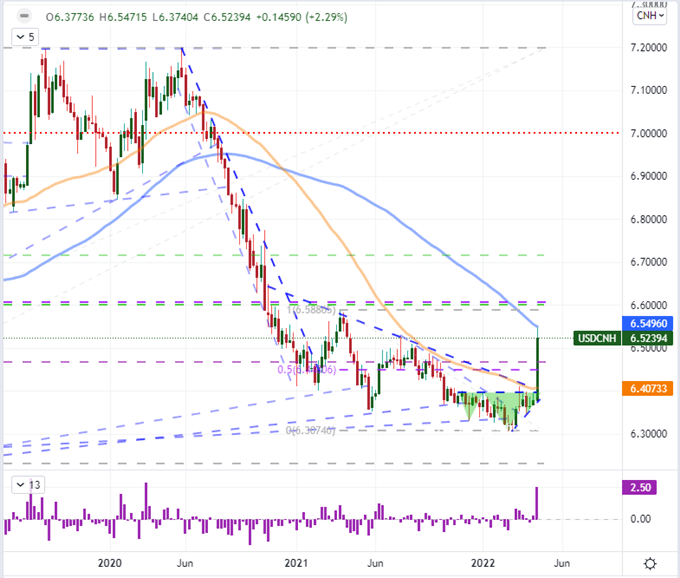
For highlights outside of the tangible fundamental tracks, there are two serious highlights worthy of monitoring. The French elections have a skew in expected outcomes, but the unexpected would represent an extraordinary impact on the global order – socially, economically and financially. Another unusual highlight worthy of close monitoring in the weak ahead is the slide of the Chinese Yuan. There has been a significant slide – and foreign capital outflow – from Chinese assets across the board. That would normally lead to a local currency swoon, but that is not always the result from this managed exchange rate. Yet, it seems there is some assumption from policymakers that a weaker currency could offer some economic benefit through exports among other outlets. USDCNH posted an extraordinary 4-day rally this past week, making me think that traditional technical patterns like the inverse head-and-shoulders pattern we clear are viable – though this is more likely a move that reflects the intentions of Chinese authorities. That said, how far do they intend the Yuan to slide?
Chart of USDCNH with 50 and 100-Week SMAs and 1-Week ROC (Daily)

Chart Created on Tradingview Platform


