


S&P 500 ETF, USDJPY, CADJPY, EURJPY and EURGBP Talking Points
- The Trade Perspective: Pairing Dow Bullish to Nasdaq 100 Bearish; CADJPY Bearish Below 95; GBPCAD Bullish Above 1.6775; GBPNZD Bullish Above 1.9350
- While the S&P 500, Dow and Nasdaq 100 managed to clear very prominent technical hurdles (resistance) this past session, there was absolutely no follow through
- The top performing market is the Yen crosses which continue to soar despite ‘risk’ hesitation, but will Ukraine and monetary policy updates change that mix?

Not the ‘Risk On’ Bulls Were Hoping For
If you are an unwavering bull, the market’s performance this past session was likely a serious disappointment. While the reach of the various markets with a sentiment-tag attached to them was generally tepid, the US indices seemed to show up with the big technical achievement on the jump with Tuesday’s New York open. While the Nasdaq 100 and Dow earned their own stripes, it was the S&P 500 that really stood out on my charts. When the New York exchanges began to price again, there was a fairly modest bullish gap (approximately 0.2 percent), but it was enough to clear the collective 200-day moving average and midpoint of the 2022 range at 4,470 or 445 on the SPDR ETF. For pent up speculative appetite looking for a signal, that could have been the cue. And yet, the market didn’t advance much further than that initial charge. Clearing the overhead does alleviate some of the bearish technical pressure on the market – which compounds the fundamental issues of Russia’s war on Ukraine and a committed monetary policy authority to tighten the liquidity reins – but it does not guarantee follow through. A break and trend are two very different states.
Chart of SPY S&P 500 ETF with Volume and 100-Day Mov Avg (Daily)
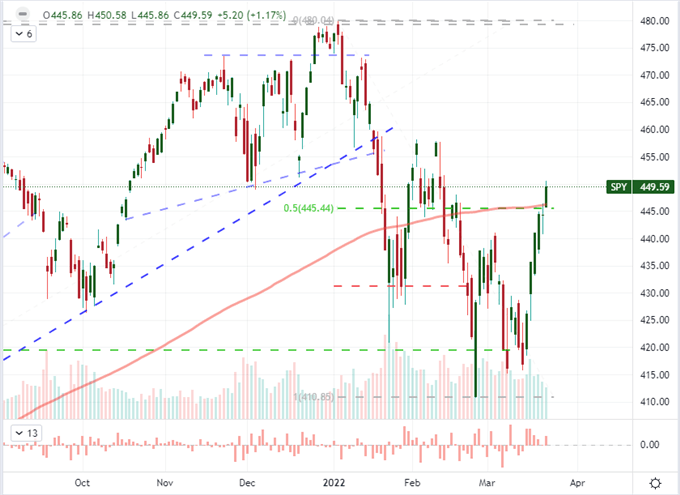
Chart Created on Tradingview Platform
Zooming in on the price action through this past session, we can get a better sense of the intent. The same 50% Fibonacci retracement is seen on the 10 minute SPY chart below, but just as clear is the loss of momentum after the opening charge. If you look to assets that trade with liquidity prior to the official exchange open like the S&P 500 emini futures, the same exact setup is shown: hovering below support waiting for the NY open. It seems that speculators were attempting to catalyze a technical break that could cater to last week’s more prolific rebound and fuel follow through that the instigators could later profit upon. What we were left with was a disappointing ‘relief rally’ but it nevertheless took out an effective resistance level. Looking out at other ‘risk-oriented’ assets, the market was just as unconvincing about its intentions. Global equities, junk bonds and emerging markets were similarly constrained. If I am going to adopt any serious bullish expectations, a fundamental backer is essential. A breakthrough on Russia’s assault on Ukraine or the central banks pumping the breaks on their tightening effort would be good enough for a short-term charge, but we haven’t seen much foundation for that taking root.
Chart of SPY S&P 500 ETF with Volume and 100-Day Mov Avg (Daily)
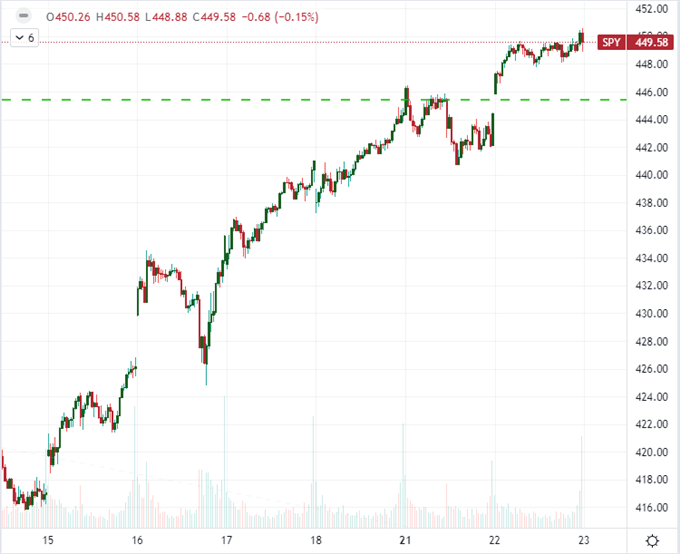
Chart Created on Tradingview Platform
The Outlier of the ‘Risk’ Measures
Over the past few years, I’ve watched the various risk asset types that I track rise and fall depending on the general conditions. Throughout this course, the FX-based ‘dividend’ play in carry trade has established a more significant deviation from the traditional measures like global equities. That deviation was a more a disadvantage for carry for the most part…until recently. While we have seen a spurt of activity recently from the likes of the S&P 500, there has been a far more impressive charge for the Yen crosses as risk appetite, interest rate forecast and commodity inflation (a terms of trade drive against the Japanese currency) have traded their position at the wheel to push these pairs higher. The top performing Yen cross is still CADJPY which has extended its rally with a 1.3 percent charge to an official 10th consecutive session of gain which is the longest rally since April 2014. Historically, this and other Yen crosses hold a fairly strong correlation to the S&P 500, but this charge certainly generates a premium.
Chart of CADJPY with 200-Day Moving Average and Consecutive Candle Count (Daily)
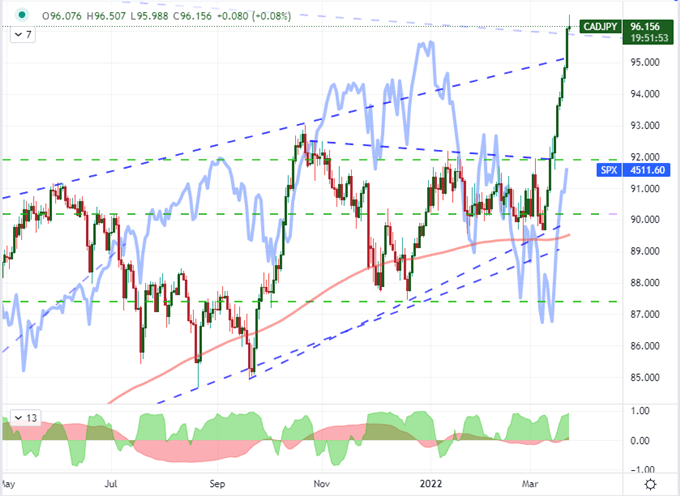
Chart Created on Tradingview Platform
While the charge behind the Yen crosses is impressive and it a fairly distinct fundamental backing via rising interest rate expectations, I think the move is very stretched. Yet, ‘stretched’ does not mean that the markets have to reverse course immediately. There are many times in financial history where markets have ‘remained irrational longer than the idealists have remained solvent’. That said, it is important to establish a strategy in case these markets short start to fall back to earth. While I like the technical look and fundamental arguments of USDJPY, CADJPY and GBPJPY; EURJPY represents a better balance for me. There is still range resistance in view for this cross and it has perhaps the most underwhelming yield forecasts of all the major crosses. Of course, I am not going to simply try to pick a top. I’ll look for evidence that the market is turning on both these pairs with technical cues but also look for a clear fundamental thread which the market-at-large is likely to follow. Patience is a virtue.
Chart of EURJPY with 20 and 200-Day SMAs and 20-Day Disparity Index
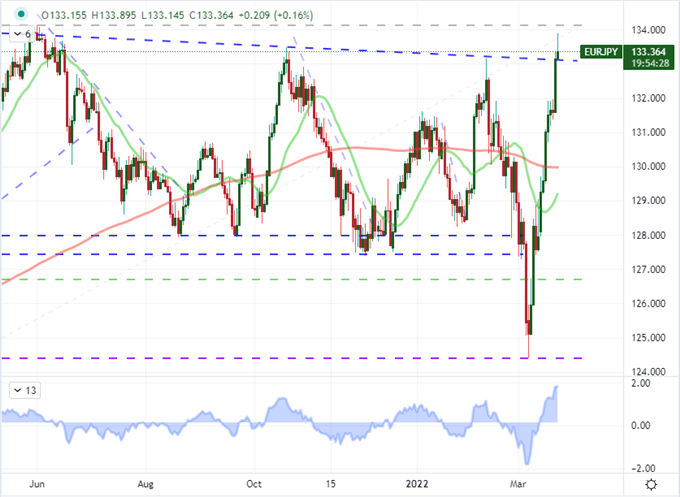
Chart Created on Tradingview Platform
What’s Officially On Deck
I’m fully tuned into the general ebb and flow of ‘risk’ as we move into the middle of the week, and that is more a market conditions assessment rather than a focus on technicals and/or fundamentals. Nevertheless, you have to keep tabs on the critical levels and top event risk. In latter’s case, there is plenty of high level event risk through the next 24 hours. Both the themes of Russia and monetary policy will be well represented by the economic docket ahead. As for the aforementioned country’s war on Ukraine, US President Joe Biden is due to meet NATO leaders and join the European Council to talk about the latter’s energy dependence on Russia and the sanctions more generally. A breakthrough on this front would be welcome, but it is likely to end with a further inching towards more dire relationships globally.
Calendar of Major Economic Events
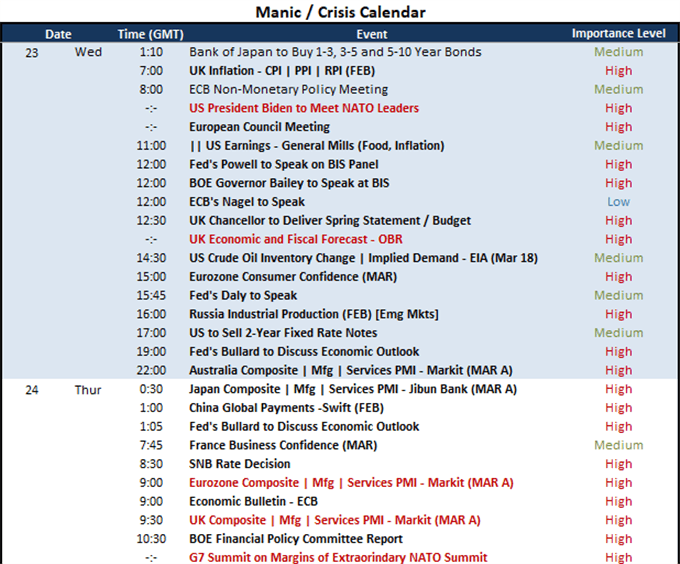
Calendar Created by John Kicklighter
On the monetary policy front, there are plenty of central bank speakers on deck to speak on a variety of topics. I am most interested in hearing what the central bank leaders have to say. Fed Chairman Powell and BOE Governor Bailey and are up, but if you want bombastic commentary, it is more likely from constant rabble rouser James Bullard, St Louis Fed President. Speaking of monetary policy speculation, the BOE’s prospects will be in particular relief given the release of February inflation statistics and the economic forecast as part of the Spring Statement. Among the Pound crosses, I like the GBPNZD given its aggressive one-way move and the discount the BOE rate outlook has been afforded relative to its RBNZ counterpart.
Chart of GBPNZD with 20 and 200-Day SMAs and 20-Day Disparity Index (Daily)
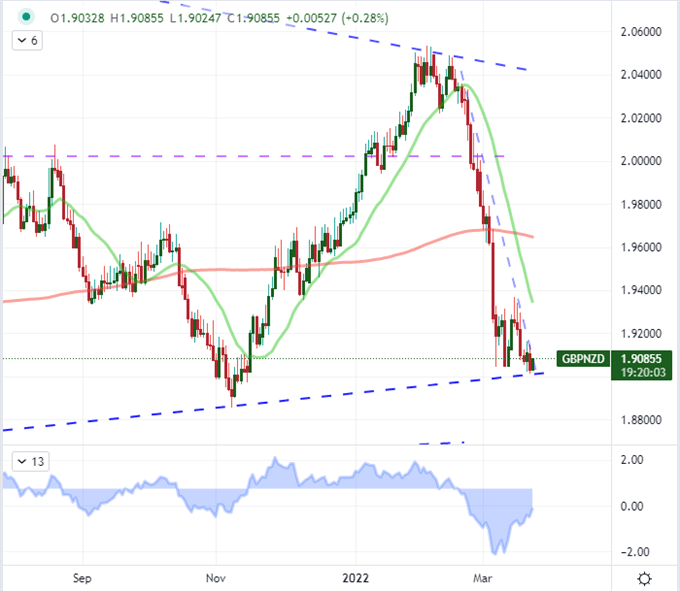
Chart Created on Tradingview Platform


