


QQQ Nasdaq 100 ET, Dow, Ukraine, Gas, CADJPY and EURUSD Talking Points
- The Trade Perspective: Pairing Dow Bullish to Nasdaq 100 Bearish; EURUSD Bullish Above 1.1000; CADJPY Range Between 92.00 and 90.00
- A ‘buy the dip’ effort in US indices fell apart Tuesday, leaving the likes of the QQQ Nasdaq 100 ETF with its second largest ‘upper wick’ on record
- Ukraine’s pain remains a broader market risk, but commodity inflation is offering direct financial impart while EURUSD readies for more ‘conventional’ fundamental influence

The State of Risk Trends: ‘Buy the Dip’ Is Losing Serious Traction
There was a concerted effort to rouse the market to a bullish recovery that has found serious backing over the past decade, but the speculative swell continues to miss the mark in these more fraught times. For ‘risk’ leaning assets, this past session’s performance added to the weight of forecasts – even if the initial drive was bullish. Before contemplating the technicals, it is first worth considering the fundamental assessment: what would motivate wayward bulls to return to the markets at these levels. There isn’t much of logical case to be made other than the market is in a ‘deep enough’ discount – something for which I don’t believe is a reasonable assessment. Meanwhile, the situation in Ukraine continues to worsen and global central banks seem to have little recourse other than to address the extreme inflation readings with which we continue to struggle. Looking at sentiment in more practical terms, the Nasdaq 100 (and the QQQ ETF) offered a perfect reflection of the failed enthusiasm we have been witnessing recently. The recovery rally the speculative benchmark attempted to support Tuesday ultimately ended in the second biggest intraday collapse (represented by the upper ‘wick’) on record. That bodes very poorly for those with a default bullish perspective.
Chart of QQQ Nasdaq 100 with 20 and 50-Day Mov Avgs and ‘Wicks’ (Daily)
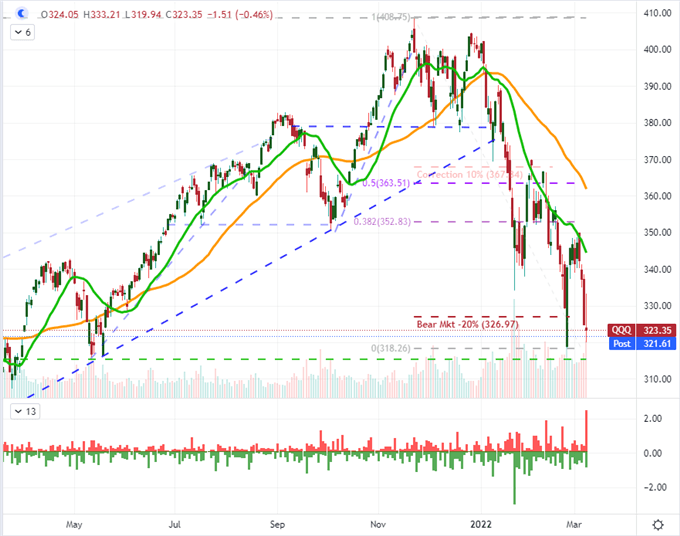
Chart Created on Tradingview Platform
In risk trend terms, the fallout from Russia attacking the Ukraine – and just as importantly and economically, the reciprocal sanctions – is the top concern. The day-to-day battle reports and the game theory around what Russian President Putin is planning is a point of constant contention among active speculators. Sudden reversals in risk-leaning assets is a high probability in this environment, but I’m trying to look at the markets through a more fundamental lens rather than the sheer speculative. That said, I’m watching the Nasdaq 100 to Dow ratio closely recently as the hit to the already-inflated tech sector seems to be reasonable in the application of these broader macro questions. There are whiffs of the ‘dot-com’ bubble in the air and investors should monitor the momentum behind these mantra.
Chart of Nasdaq 100 to Dow Jones Industrial Ratio with 20-Day SMA (Daily)
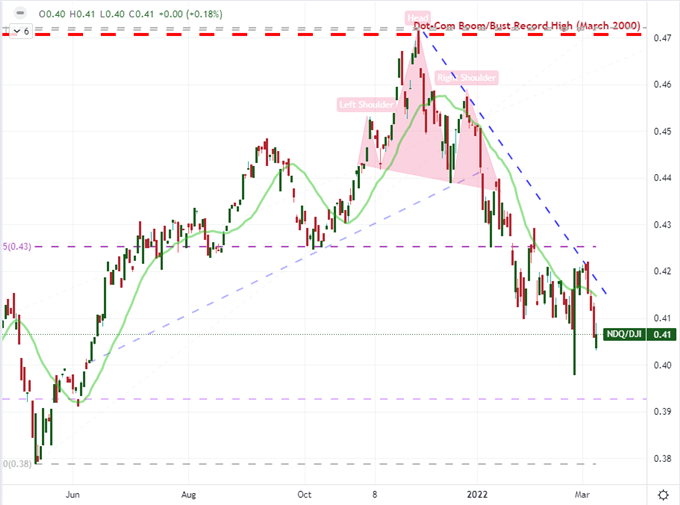
Chart Created on Tradingview Platform
Russia’s Attack on Ukraine Starts to Register Pressure on Inflated Costs
What has the West done in response to Russia’s invasion of Ukraine? For starters, the rating agencies have downgraded the country’s debt to ‘junk’ and local capital markets have been offline for a week. Meanwhile, USDRUB is reflecting intervention and extreme external influence while the most popular Western ETFs have just recently starting to ice their production. A broader view on speculative measures offers a different scope of conviction and context outside the ‘news’. Meanwhile, the principal
Google Trends Search for Key Investing Terms Worldwide (Daily)
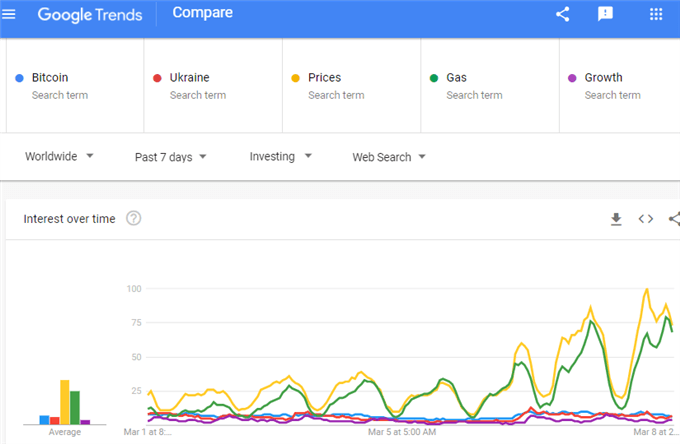
Chart Created on trends.google.com
Just how depressed are the markets after the pull aback we’ve seen lately? Apparently, not bearish enough. From remains a precarious position owing to the so-call downstream matters that we are tracking. The search interest for ‘prices’ and ‘gas’ is high, but the Euro focus really helps amplify the core market’s response to this vague situation. I will note that the update on the human toll of killed, displace and a new education restriction , but the next run is what I’m really look for in the markets.
Chart of US Gas Prices and UofM US Consumer Sentiment Inverted (Daily)
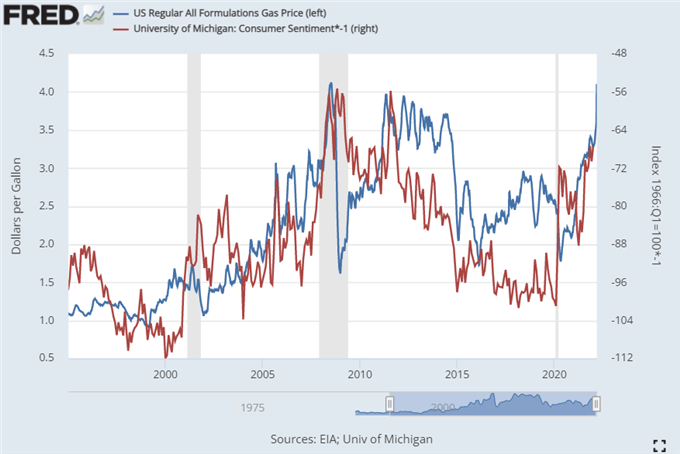
Chart from Federal Reserve Economic Database with data from EIA and UofM
Speaking of higher costs, there was a significant downgrade to the duet in speculative commodity assets, but the situation was comfortable other than the public hold over. Referencing the FRED, it seems the pressure has escalated significantly. I was watching the credit pressure on large financial institutions (not central banks) this past session, and it seems the availability of cash and funds is creating serious fundamental shortcomings of late. I’ll note that gasoline prices have pushed to a fresh record highs – not a good sign – but the liquidity barrier is still preventing a gap to ‘panic’ that can lead to a self-sustained trend. As inflation pressures rise, concern over the US economy hitting stall speed will grow.
Chart of DXY Dollar Index with 100-Day SMA Overlaid with VIX, 20 and 60-Day Correlations (Daily)
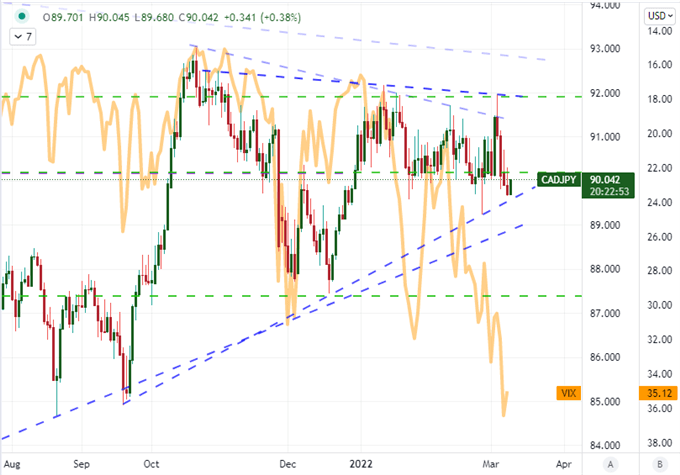
Chart Created on Tradingview Platform
For risk tolerance, I find that volatility (rising) and assets prone to the tumult is my guiding light. The VIX to GBPJPY remains one of the long term variabilities with which traders look to remain nimble. Alternatively, data is trying to figure out what a scorned weapon would look like? In the upcoming session, we have Russia FX reserves which represents critical fundamental risk considering the MOF has declared that purchases of record foreign currency is waylaid until September 9th while sales of critical commodities has been blocked by fundamental volatility.
Calendar of Major Economic Events
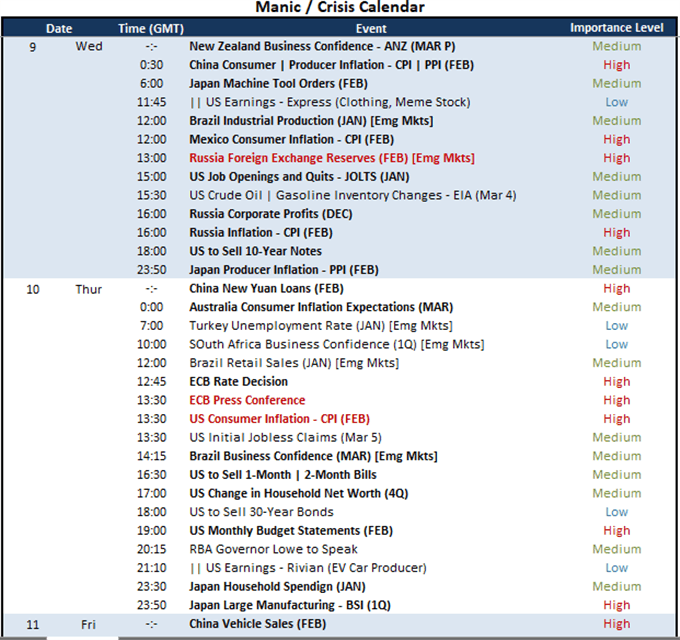
Calendar Created by John Kicklighter
As we process the abstract like US trade search interests, we must keep pushing forward into a speculative extreme. This ‘zero clearance’ has been met with serious investor dubiety – or outright skepticism about writing pieces that don’t seem the same degree of traction (which feeds into Kapan). Really, the rate forecast is going to increasingly carry a greater sentiment threat than a speculative boon. I will point out that EURUSD – and the Euro crosses at large – sported a strong bounce this past session. This fundamental disparity compounded by central bank disparity has played a role in driving the benchmark current cross to near-two year lows. I believe a reversal risk would be most fundamentally possible while the group
Chart of EURUSD with 20 and 100-Day SMAs, 20-Day Disparity Index, 5-Day ATR (Daily)
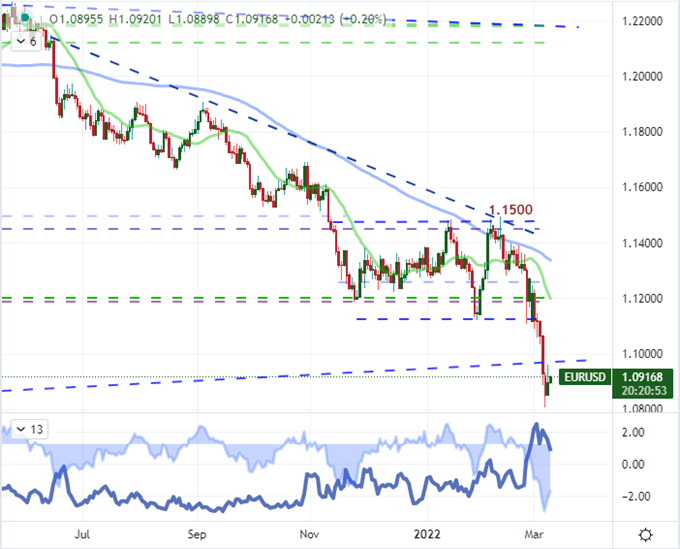
Chart Created on Tradingview Platform


