


Nasdaq 100, VIX, Volatility, Commodity and Dollar Talking Points
- The Trade Perspective: Pairing Dow Bullish and Nasdaq 100 Bearish; USDJPY Bear Below 114; CADJPY Range Between 92.00 and 90.00
- The United States’ Nasdaq 100 and Germany’s DAX 40 indices both closed with official ‘bear’ markets – 20% correction from all-time highs – Monday
- Russia’s attack on Ukraine remains the principal fundamental fuel, but the financial impact is coming through the a surge in commodity prices like oil’s test of 130

Risk Aversion Has Accelerated with a Few Official ‘Bear’ Designations
Speculative appetite across the financial markets is typically the convergence of a chaotic mix of wildly different views on fundamental value and competitive positioning among thousands upon thousands of market participants. Yet, sometimes there is a clarity that cuts through the market resulting in a decisive drive in sentiment across the landscape. This week has started to just such a move of lucidity as the economic spillover of the Russian invasion of Ukraine struck a serious nerve. The unwind in risk exposure was broad through this past session, but there was an impression to be made through a few of the capital market’s most prominent benchmarks. The tech-heavy Nasdaq 100 officially closed into a ‘bearish market’ (defined by a 20 percent drop from all time highs) following the second worst daily selloff (-3.8 percent) in 18 months. While the S&P 500 and Dow are still a ways off from such severe reversals of their own, there is a more global confirmation. Germany’s DAX 40 – representing Europe’s largest country – has also established a technical bear market Monday. I’ll be watching Japan’s Nikkei 225 – Asia’s largest aside from China – today as it on the verge of earning the unfavorable designation on its own (the line in the sand is 24,672).
Chart of Nasdaq 100 with 20-Day Moving Average (Daily)

Chart Created on Tradingview Platform
As dramatic as Monday’s volatility was, there have been spells of sudden intense market movement in the recent past that haven’t escalated to full-blown trends. It can be difficult to discern the signal from the noise, but the evidence is building behind a more entrenched flight from the world’s investors. Putting aside the motivations for risk aversion for a moment, there has been a deeper correlation among the major asset classes and different regions around the world which is one of my preferred barometers for underlying risk appetite. Though more typically prone to mean reversion, another extraordinary indication of a collective fear weighing on the world’s investors is the swell in implied volatility across the different asset classes I track most closely on a macro view. The VIX closed above 35 percent to its highest level in 13 months, but that wasn’t as impressive as some of the other measures of activity. Naturally, crude volatility hit its highest levels since the pandemic inversion, but bond volatility has absolutely soared, FX volatility is the highest in two years itself and even Gold volatility (the commodity considered a safe haven) has reached levels with similar historical context.
Chart of Risk Assets Relative 12-Month Performance (Daily)
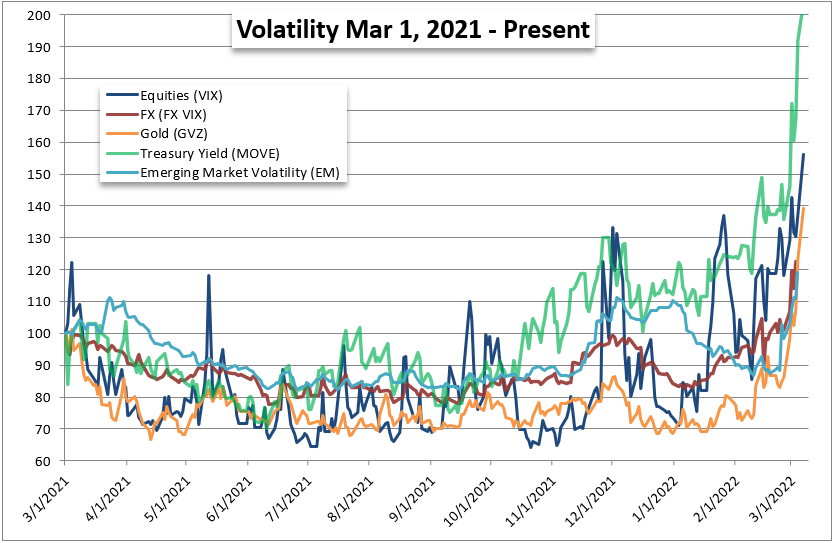
Chart Created by John Kicklighter with Data from Bloomberg
The Obvious ‘Why’: Russia’s Attack on Ukraine Extends Into a Third Week
I take issue with assigning the ‘why’ of a systemic market development to a single motivation – there are many different market participants with differing views on what is priority and where these themes will head next. However, at this point, it seems the pent up pressure behind speculative assets seems to have found a clear lead in the Russian invasion of Ukraine. The third meeting of representatives from both countries ended Monday with no discernable progress towards a ceasefire. Meanwhile, there seemed a concerted effort over the weekend and into Monday to leak conversations among Western leaders discussing a possible full embargo of Russian energy products. That would certainly increase the impact on Russia’s economy, but it would also represent a heavier blowback on the developed world. Point-in-case was the surge in the US-based benchmark WTI crude oil. The key commodity to growth closed up 3.7 percent over Friday’s close, but it was up as much as 13 percent (above $130 per barrel) during the New York session. That is a severe escalation on inflation pressures that area ready very onerous for the world.
Google Trends Search for Key Investing Terms Worldwide (Daily)
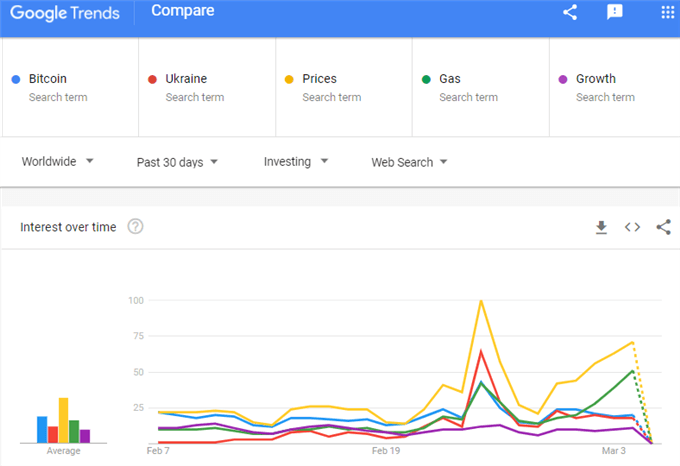
Chart Created on trends.google.com
Even if you aren’t trading futures or other derivatives that track crude, you should be watching this market. It is akin to NFPs to the evaluation of the US economy’s health – far from a comprehensive measure, but symbolically it tends to guide the market’s general view. That said, inflation is proving a much broader issue than the cost of energy prices. Metals like nickel and principal building material lumber have seen sustained rallies. Bringing it back to a direct connection to Ukraine, however, the wheat prices have seen a series of limit up days pushing record highs. The country currently under attack is one of the largest exporters of wheat and the ninth largest producer of grains in general. It is worth watching a broader view of commodities to asses the upstream inflation pressure, and the DBC index below is one of the largest.
Chart of DBC Invesco Commodity Index Fund with 20-Day Moving Average (Daily)
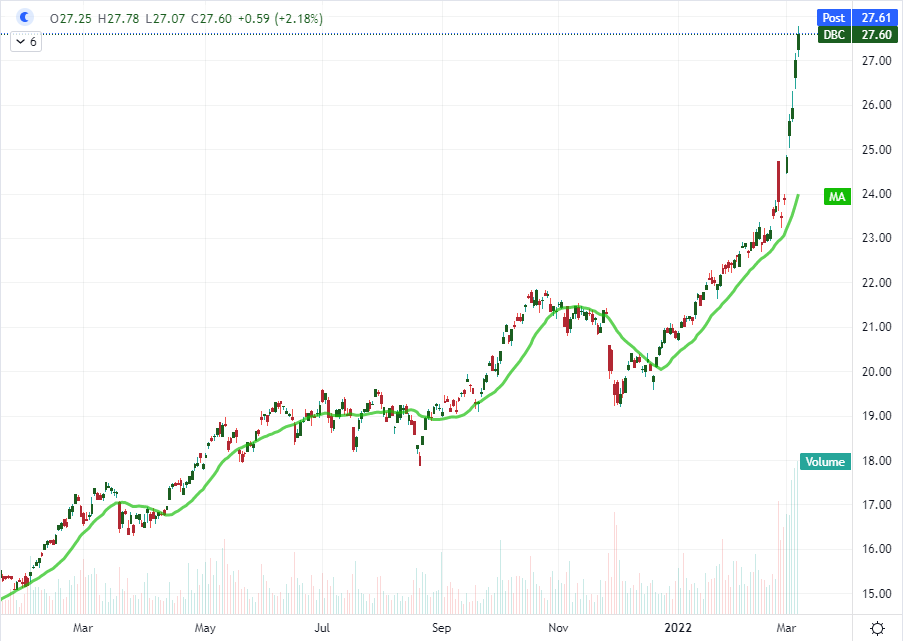
Chart Created on Tradingview Platform
The Safe Havens Are Stepping In
As the so-called ‘risky assets’ converge in their swoon, the safe havens are also finding a productive correlation. That said, there are some conflicting aspects to the particular catalysts in the market that are pushing certain textbook havens of course. One interesting abnormality is in the US Treasury market. The world’s most liquid sovereign debt is certainly finding a bid as fear rises and global investors avoid certain international pariahs (Russia and China), but there is some unusual develop in the curve. The so-called ‘2-10 spread’ – US 10-year Treasury yield minus the 2-year yield – serves as one of investors’ favorite growth and recession gauges. When the spread flips, it is considered a high probability the US economy will soon fall into recession. At less than 25 bps, from 165 bps just a year ago, this seems a dangerous probability. However, if you look at economists’ preferred 10-year to 3-month yield spread; there is almost none of that urgency. The difference is that the 2-year yield is more aligned to Fed rate forecasting while the 3-month is more indicative of critical liquidity. That is speculation for returns versus confidence of stability, which is also a feature of the US Dollar. The DXY Dollar Index hit its highest level in 21 months this past session and its correlation to the VIX tightened sharply.
Chart of DXY Dollar Index with 100-Day SMA Overlaid with VIX, 20 and 60-Day Correlations (Daily)
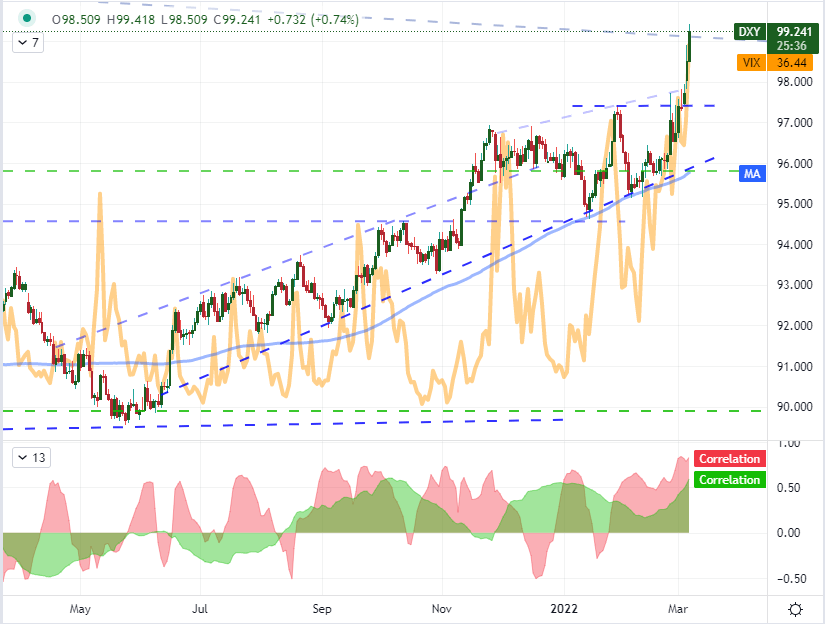
Chart Created on Tradingview Platform
If you are looking for the market’s motivations over the coming 24 to 48 hours, there are certainly economic indicators worthy of evaluation…but more so for economists. The market traction at present is focused on the economic and financial fallout from Ukraine (markets are agnostic so the terrible human toll doesn’t tend to factor into price), so headlines around this theme are top priority and scheduled event risk should be interpreted through that lens. For example, while US trade and import/export inflation are important, they are reviews of January. Instead, I want to see the business and economic sentiment surveys for February/March from Australia (NAB), Japan (Eco Watchers), US businesses (NFIB) and the US economy (IBD). I’ll also be keeping a very close eye on weekly oil inventories as prices have been so explosive that they can prove self-sustaining with little warning.
Calendar of Major Economic Events
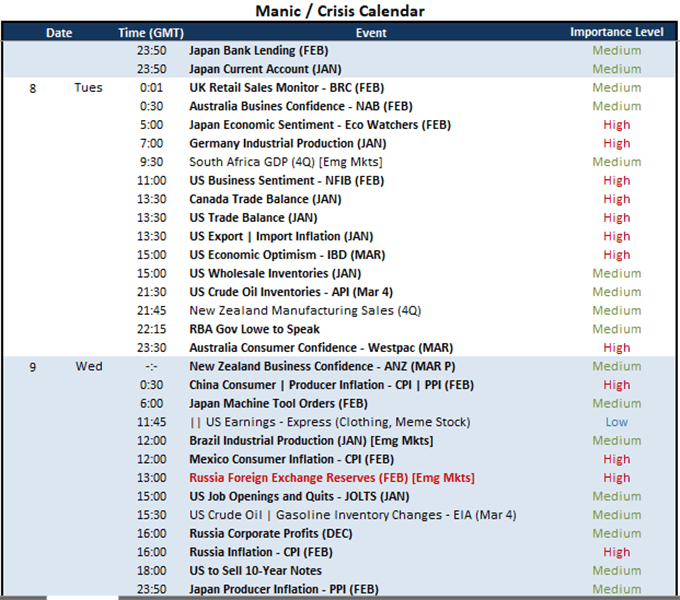
Calendar Created by John Kicklighter


