


Ukraine, Russia, SPDR S&P 500 ETF, QQQ Nasdaq 100 ETF and EURUSD Talking Points
- The Trade Perspective: SPY Bearish Below 426; USDJPY Short Below 114; AUDNZD Bearish Below 1.0700
- Russia moves further into Ukraine as the West responds with escalated sanctions with serious financial market implications…so why did the S&P 500 and Nasdaq 100 spur a strong reversal?
- Eurozone consumer inflation expectations and the Fed’s favorite US price gauge are due Friday, but how weighty are rate forecasts amid a geopolitical focus?

A Full Tilt Bullish Reversal or Distracting Bear Market Bounce?
We are faced with a dichotomous technical and fundamental picture from the global markets heading into Friday. On the one hand, we have the situation in Ukraine which has noticeably deteriorated as Russian forces escalate their military campaign into the country and Western powers respond with increasingly aggressive sanctions. Yet, despite the implications this would insinuate, we were presented with an enormous rally from perpetual ‘risk’ benchmarks in the US indices. Through the end of this past session, the S&P 500 gained 1.5 percent, the Nasdaq 100 charged 3.4 percent and the Dow Jones Industrial Average gained 0.3 percent. That may not seem that extraordinary, but you’d have to register what happened on the open Thursday to truly absorb how remarkable this past session was. So, where do you stand? Is this the persistent bullish interest that has been so persistent over the past decade once again showing through or is this a mere bout of opportunism that is destined to fizzle out under serious market weight? There seems to be a serious skew in the poll I ran this past session towards the latter interpretation, but you need to make your own call on conviction.
Poll Asking Whether US Indices Rally Was New Trend or Temporary Rebound
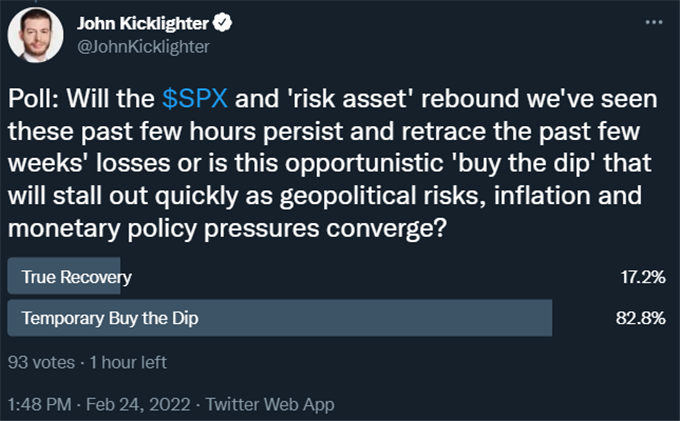
Poll from Twitter.com, @JohnKicklighter
As far as turnarounds go, the turn from US indices Thursday was frankly extraordinary. The most remarkable among the majors was the initial gap down and subsequent rally from the tech-heavy Nasdaq 100. This speculative favorite opened the past session in a technical ‘bear market’ which is a -20 percent drop from all time highs. The market then went on to charge an incredible 6.8 percent rally from the session low through the close. That is a monster intraday reversal, and it is not difficult to understand why unrelenting bulls would view this as a sign of the undying enthusiasm at work. That said, I’m seriously skeptical. While the rebound was sharp, we are still on the verge of a technical close in ‘bear’ territory. Further, volatility can unfold in both direction. A rebound this past session does not absolve us of inherent instability which could see sentiment flip and drive us lower with little warning. It is also interesting to note the progress of the Nasdaq 100 relative to the Dow Jones Industrial Average where we are monitoring sheer ‘trader’ interest relative to the broader market performance.
Chart of QQQ Nasdaq 100 ETF with Daily Gap and Daily Change (Daily)
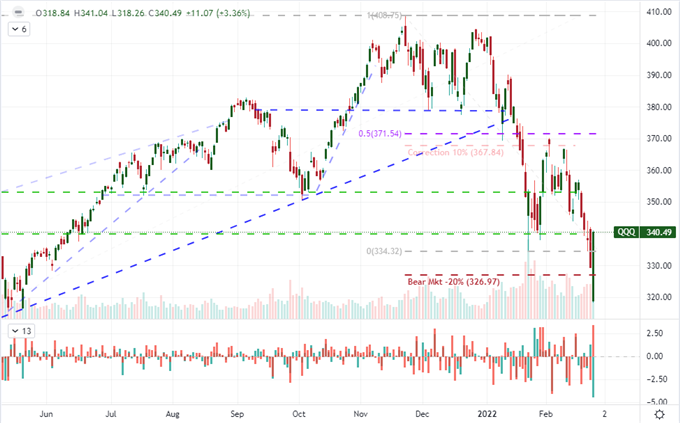
Chart Created on Tradingview Platform
A Severe Speculative Session
Just how extreme was this past session? On a day where there was a severe gap lower to start the session for US indices which would ultimately end in positive territory – and in the case of the Nasdaq 100, impressively so – there has to be some assessment on how unique the situation is. Using the QQQ ETF, I decided to assess how many instances there were of a more than -3 percent gap to the downside where the market ultimately ended up 3 percent (close over close) on the day. There were only two other times in history that happened: on April 27, 2000 and August 3, 2000 – amid the collapse of the Dot-Com bubble collapse. Lowering the measures, I decided to see how many instances there were over the past 22 years where there was a 2 percent gap and subsequent 2 percent move in the opposite direction on the same day. While not as extreme, it is still a rare phenomenon. And, once again, it was an occurrence found in very volatile markets. That’s what we have: volatility. To call a renewed bull trend is exceptionally presumptuous when the markets are so unstable that another fundamental surprise could reverse the market with little warning.
Chart of QQQ Nasdaq 100 with Instances of More than 2% Gaps and 2% Reversals (Daily)
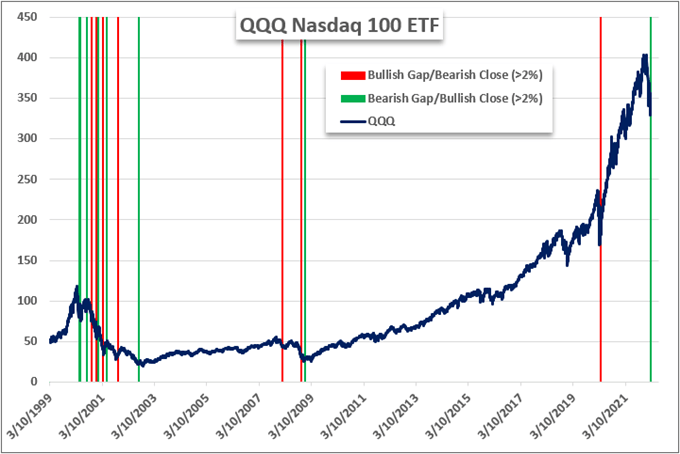
Chart Created by John Kicklighter with Data from TradingView
Leaning against trends may be a reasonable approach to markets when we are facing a range environment, but congestion usually flourishes in low volatility. We seem to have anything but ‘low volatility’. Nevertheless, the inexperienced retail view is relentless. Among IG’s CFD traders, we find that there was a significant swell in net long interest looking to take advantage of the break through 33,000. If markets are not ready to establish a new trend, such volatility can be a stretched rubber band simply waiting to snap back. However, what if the bounce is just that – a bounce without commitment? We have the fundamental pressure and the speculative uncertainty necessary to permanently undermine the complacent ‘buy the dip’ mentality that has held out for so long across these markets.
Chart of Dow Jones Industrial Average Overlaid with IG Net Speculative CFD Positioning (Daily)
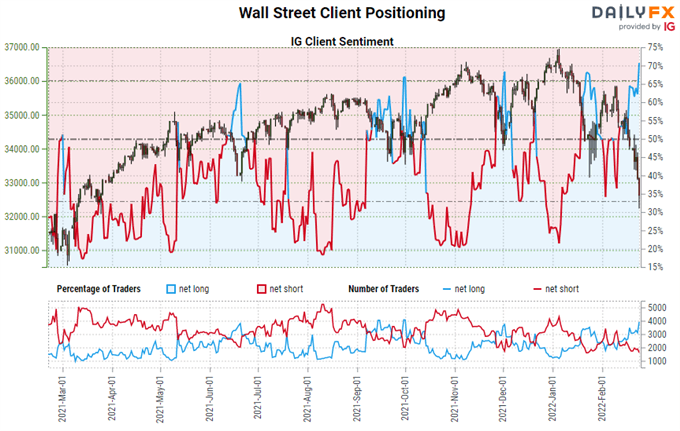
Chart Created on DailyFX.com
There is Also Interest Rate Expectations
With a shock to the speculative system, you’d typically expect monetary policy groups to respond with a panicked soothing message. Yet, we haven’t really seen that happen this time around. There are of course those dovish central bank members that are looking to amplify their message of restraint, but there are even more hawkish policy players that are refusing to back off of their views that tightening is a necessary evil. This past session’s volatility would have cowed any Fed official into abstaining from any thought of normalizing extreme stimulus just a few years ago, but that doesn’t seem to be the case now. In fact, FOMC board member Christopher Waller said he still sees a case for a 50 bp hike come March 16th should the data remain as pressurized as it has been over these past weeks. Fed Fund futures may not be as certain as that Waller on that big opening move, but they continue to fully price in 25 basis points next month, 21 percent probability of 50 basis points and fully 150 basis points (six standard 25bp hikes) through year’s end.
Chart of EURUSD with 100-Day SMA and 1-Day Rate of Change (Daily)
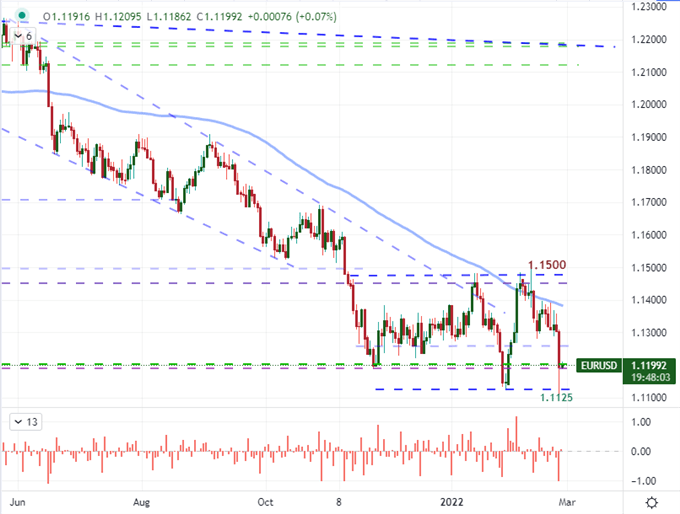
Chart Created on Tradingview Platform
Rate expectations in mind, fundamental traders would do well to keep an eye on the economic docket. While the situation in Ukraine can easily take over the market’s yoke, there is very explicit monetary policy insight due through Friday’s session. In particular, we are due a clear contrast on behalf of EURUSD. On tap through the coming session, we have the Eurozone consumer inflation expectations figures for February and the Fed’s favorite Personal Consumption Expenditure (PCE) consumer inflation report for January. EURUSD took a big hit this past session and it wasn’t just a reflection of the Greenback’s safe haven status and/or the Euro’s exposure to a proximate war. There is a relative monetary policy commitment being factored in. Watch this cross and watch what we do around 1.1100.
Chart of Major Macro Economic Event Risk
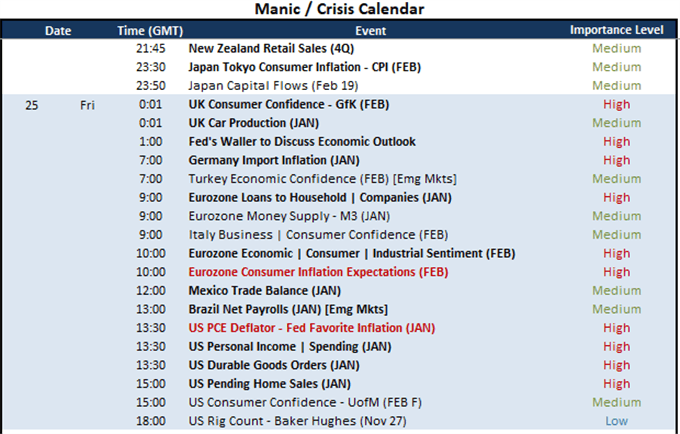
Table Created by John Kicklighter


