
SPDR S&P 500 ETF, VIX, Interest Rates, Dollar, Gold and Oil Talking Points
- The Trade Perspective: SPY Bearish Below 457.50; USDJPY Bearish Below 115/114; Crude Oil Bullish Above 90
- On the back of previously unnerving headlines, news around Ukraine shifted to reports that some Russian forces were retreating from the border and the US would not have soldiers fight
- So long as the Ukraine pressure remains in remission, the focus and turn back to interest rate speculation with the FOMC minutes, key earnings, UK and Canadian inflation figures on tap
Trade Smarter - Sign up for the DailyFX Newsletter
Receive timely and compelling market commentary from the DailyFX team
The Markets are Highly Tuned to Headlines and Trading Strategies Should Reflect the Flippancy
There was a bounce in risk assets like the S&P 500 and US indices this past session that aligned neatly to relief measured in the headlines around the risk of an imminent Russian invasion into Ukraine. Moving forward, so long as this diplomacy persists between the West and Russia, the markets will draw direction and activity level from more traditional fundamental themes – like interest rate speculation which will find significant fuel through Wednesday’s trading session. However, should the clouds darken around the geopolitical threat, the markets will immediately reprioritize with a reshuffling of what markets represent haven and what stands as a ‘risk’ asset. This is not a particularly conducive backdrop for trades meant to play out over a few days up to a few weeks – unless you have rock solid conviction in your outlook, and I can’t say that I do. Short-term, event associated options or longer-term ‘positions’ seems more aligned to the market conditions as they currently stand.
Chart of SPY S&P 500 ETF with 100, 200-Day SMAs and Volume (Daily)
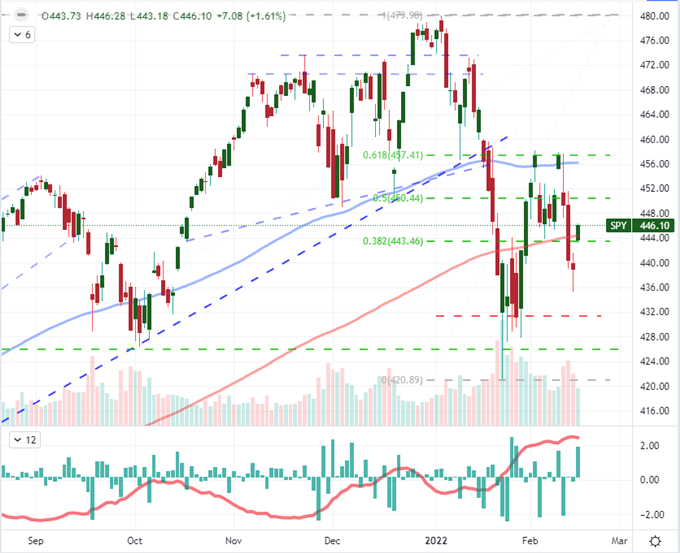
Chart Created on Tradingview Platform
To give a better sense of where the market’s priorities stand in competing fundamental themes, I’m again referring to the Google search trends across the globe segmented in investing channels in particular. I looked previously at the three month period, but honing in on just the past 7 days gives us a more time sensitive view of the backdrop. ‘Ukraine’ is still a bigger topic than rate forecasting terms or even ‘volatility’ itself. However, the matter continues to pull back from its second peak of the past week forged by reports of Russian forces ‘moving into attack position’ and the subsequent de-escalation headlines the day after. With FOMC minutes and key inflation reports ahead, I suspect ‘inflation’ and ‘interest rate’ searches will swell; but it is still fairly easy for a volatile situation like Ukraine to override the conversation.
Chart of Google Search Trends Worldwide in Investing (Daily)
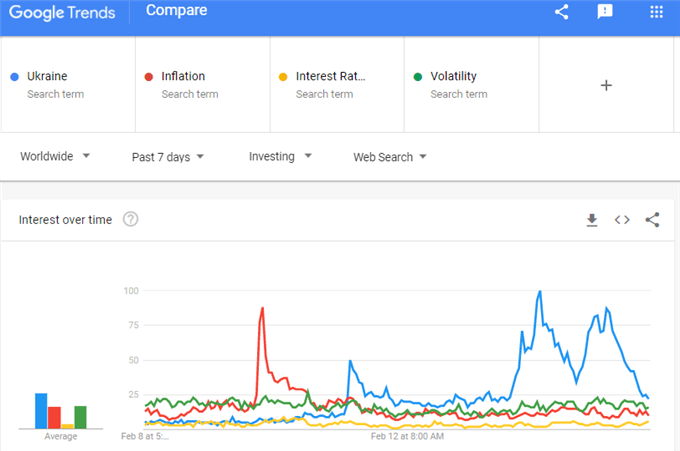
Chart from trends.google.com
While the S&P 500 and company may be more straightforward risk measures, my attention is not just focused on these personal favorite flag bearers for sentiment. Crude oil represents one of the more interesting shock absorbers as it has multiple disparate fundamental themes that seem to favor the prevailing trend. If Russia decides to invade Ukraine, the subsequent developments are likely to play out with a definitive impact on the global supply of energy commodities. Given crude is considered the ‘life blood’ of economic growth, this is clearly an at-risk market. Yet, even without the tension in Eastern Europe, we still have the supply-chain and inflation considerations associated with energy costs that keep the market under pressure. It is this kind of environment that makes the technical picture much more interesting. It is hard to miss the bullish trend channel – and even though it is mature by various measures, the elements remain for its support.

Crude Oil Futures with 20-Day Moving Average (8-Hour)
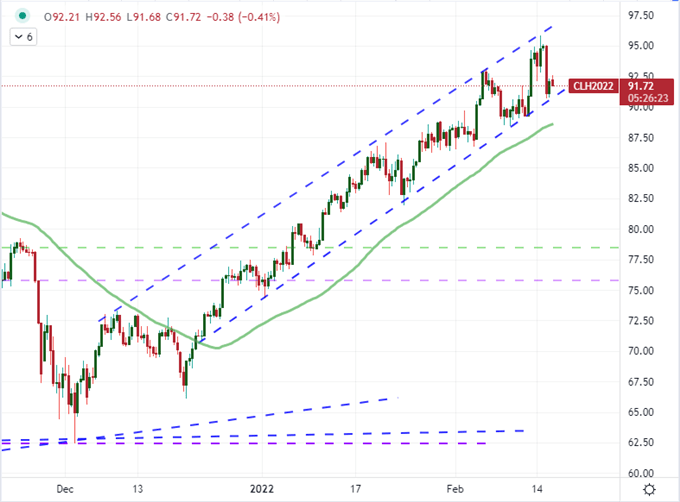
Chart Created on Tradingview Platform
In contrast to oil, gold’s recent pang of direction is fully dependent on the persistence of the fundamental drive. As soon as the threat of an imminent flare up in the global war footing faded this past session, we saw the commodity retreat right alongside the VIX volatility index. That isn’t perhaps very surprising given the asset’s safe haven status. Further unlike crude, gold has a clear sensitivity to the other major fundamental theme interest rate forecasting. How the market interprets the next 24 hours of ‘standard’ headlines for intent from the Fed and its peers will have a direct consequence in the perceived value of this asset. That said, if inflation pressures continue to outpace the central bank’s willingness or capable of containing inflation, breaking 1,880 is not impossible.

Chart of Gold Futures Overlaid with VIX Index and 20-Day Correlation (Daily)
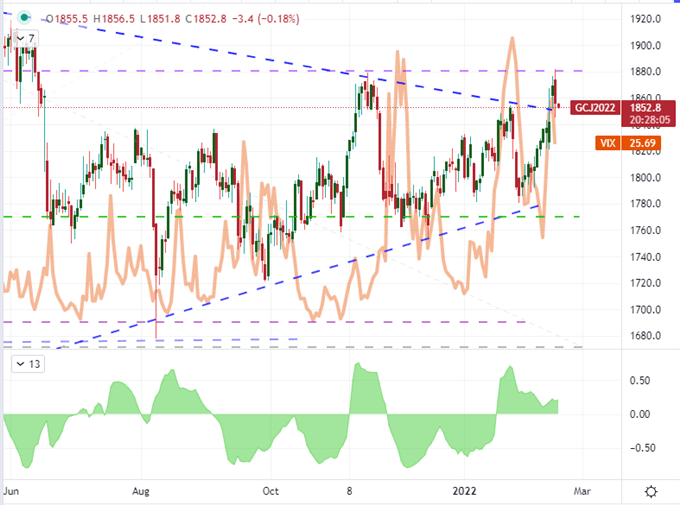
Chart Created on Tradingview Platform
The Interest Rate Fodder and Market Reaction to Monitor
Taking stock of what scheduled event risk will take control of the speculative yoke over the coming session, it is hard to miss the theme through the major releases on tap. At the top of my list is the FOMC meeting minutes. While this is technically a transcript of the meeting for which we received a run down last month, the details will be made more influential consider the dispersion of policy views across the individuals that have weighed in on policy over recent weeks. In particular, James Bullard has defined the extreme hawkish end of the spectrum and Fed Funds futures are pricing in a 58 percent chance of a 50bp hike at the next meeting. Other US event risk includes import and export inflation (secondary in my opinion) as well as growth measures like retail sales and industrial production. For a true inflation read, watch the Kraft Heinz earnings given the propensity for major companies to announce their efforts to pass on higher costs to the consumer as of late. While US policy is arguably the most heavily interpreted of late, it isn’t the only region/currency up for interpretation. In particular, the UK and Canadian inflation stats for January can set off notably hawkish backdrops.
Chart of Major Economic Event Risk
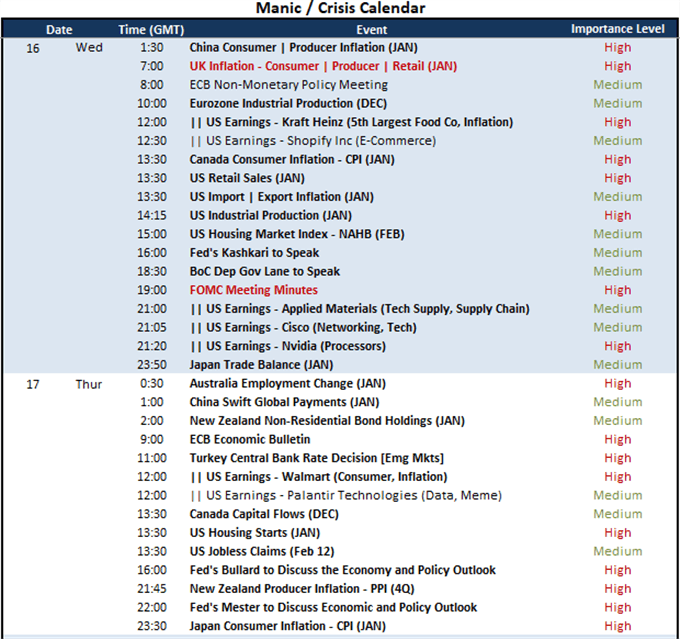
Table Made by John Kicklighter
From the Fed’s perspective with the Dollar, my interests have diminished for EURUSD given that the pair is trading in the middle of its range. Broader than that though, the Greenback has not aligned neatly to official Fed rate forecast trends for some weeks. To align the potential to a more tuned pairing, USDJPY seems better positioned. While this severe contrast in policies (very hawkish Fed and very dovish BOJ) is still not generating a like-for-like in the exchange rate that marginal rates would suggest, it is further tuned to risk trends. So, if risk aversion happens to cut down inflation rate forecasts (disproportionately on the Dollar), there will be two forces working to pull the pair lower. Technical lines in the side to contemplate alongside the fundamental evaluation are 115 and 114 breaks.
Chart of the USDJPY with 100-Day Moving Average (Daily)
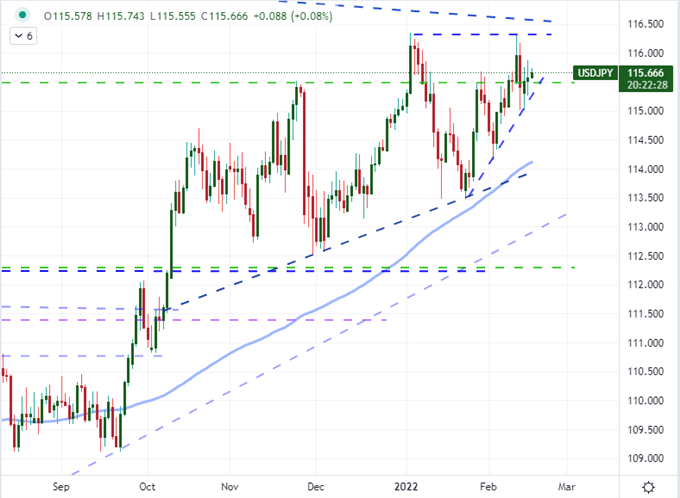
Chart Created on Tradingview Platform
As for the rate speculation surrounding the Bank of England and Bank of Canada on their respective CPI release (the UK actually has multiple measures of inflation), there are a number of GBP and CAD crosses that can be considered. Their merits differ depending on the cross, but there isn’t a lot of direct technical appeal for many of them – certainly GBPUSD and USDCAD have trouble in competing for the reins. Though prone to long periods of indecision, I will be watching GBPCAD to see how the two countries’ data compares; though this is likely to offer a better signal than perhaps direct opportunity for the pair itself.
Chart of the GBPCAD Overlaid with UK-Canada 10-Year Yield Spread (Daily)
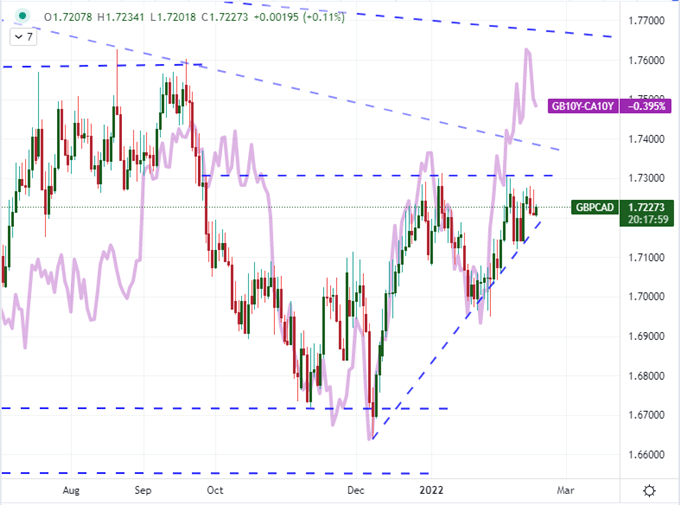
Chart Created on Tradingview Platform