


EURUSD, QQQ Nasdaq 100 ETF, Oil, Yields and EURJPY Talking Points
- The Trade Perspective: QQQ bearish below 350, EURUSD bearish below 1.140, Crude Oil futures bullish above 89
- Risk assets are holding a very narrow range relative to the level of volatility registered for the likes of the S&P 500 and Nasdaq 100
- A definitive breakout is likely for the likes of the QQQ before the week ends, but EURUSD and EURJPY are already active on shifting rate speculation
Trade Smarter - Sign up for the DailyFX Newsletter
Receive timely and compelling market commentary from the DailyFX team
QQQ and SPY Ranges Look Like a Coiling Spring
Without context, it would seem that the US indices – my preferred measure of risk trends – have shifted from serious speculative swings through this past week to a purposely controlled congestion indicative of serious moderation. The restrictive four-day range that we have seen set up for the likes of the S&P 500 and Nasdaq 100 stands out relative to the preceding two months, but I draw little reassurance from the technical barriers. If anything the narrow corridor for price action looks like a pressure cooker against the medium-term activity level of the capital markets and the still-unresolved fundamental backdrop. In other words: it looks like a breakout looking for a spark. In technical terms, the contrast can be measured through how narrow the four-day trading range (as a percentage of spot) is relative to the level of activity over the same period indicated by the ATR (average true range). Further, with a clear capital market interest in rate speculation and the US CPI inflation figure on tap for Thursday, it looks like we are merely biding our time until a more dramatic activity level returns.
Chart of QQQ Nasdaq 100 ETF with 100 and 200-Day SMAs, 5-Day ATR and Range (Daily)
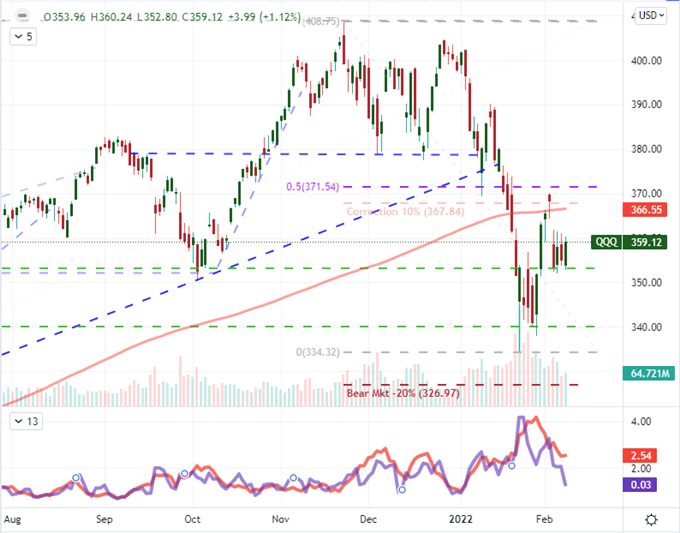
Chart Created on Tradingview Platform
One of the most remarkable features of the landscape is the level of turnover in these benchmarks measured through volume relative to how shallow liquidity is through open interest. For the Nasdaq 100 futures, that is fairly easy to measure – below shows the 20-day average of the market’s volume over the net open interest for the asset. However, this isn’t the only over-active market measure out there. Where the total market capacity can be measured in ETFs, options and other speculative popular assets; we can see much the same: there is a high level of turnover relative to a fairly constrained market scale. That contrast inherently creates instability whereby significant movement inevitability arises. Further, such activity tends to correlate to swoons in price action with volume and volatility tending to carry a negative relationship relative to the price action of the US equity indices. Now all we need is that spark.
Chart of Nasdaq 100 Futures Overlaid with 20-Daily Avg Relative to Open Interest (Daily)
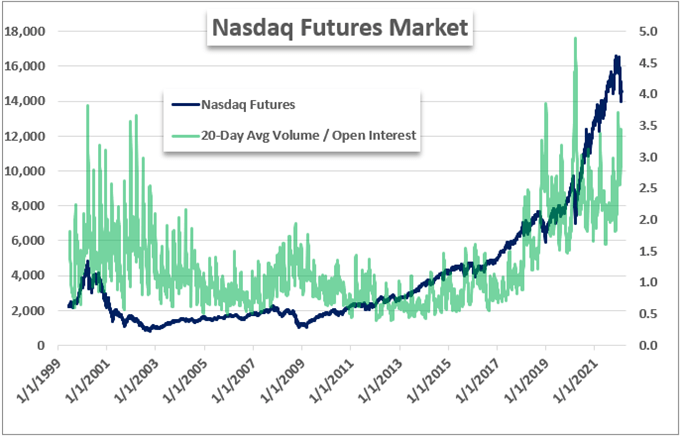
Chart Created by John Kicklighter with Data from Bloomberg Terminal
Where the necessity of technical resolution may be significant for the likes of the Nasdaq 100 and S&P 500, it is even more explicit for some other benchmarks – like US crude oil. The WTI futures contract is has carved out a remarkably persistent and aggressive bull trend over the past two months. While no stranger to explicit trends since recovering from its brief flirtation with inversion, this commodity has grown exceptionally constrained by an aggressively tempo-ed technical pattern that has pushed us to 7-year highs. A bearish break below 89 would offer some reprieve from momentum but that doesn’t align to the fundamental uncertainty surrounding the stand off between Russia and the West over Ukraine. So long as that situation remains unresolved, there will be pressure to the energy complex. It is technical strain versus fundamental pressure that should be familiar across the markets.
Chart of WTI Crude Oil Futures with 20-Day SMA and Volume (Daily)
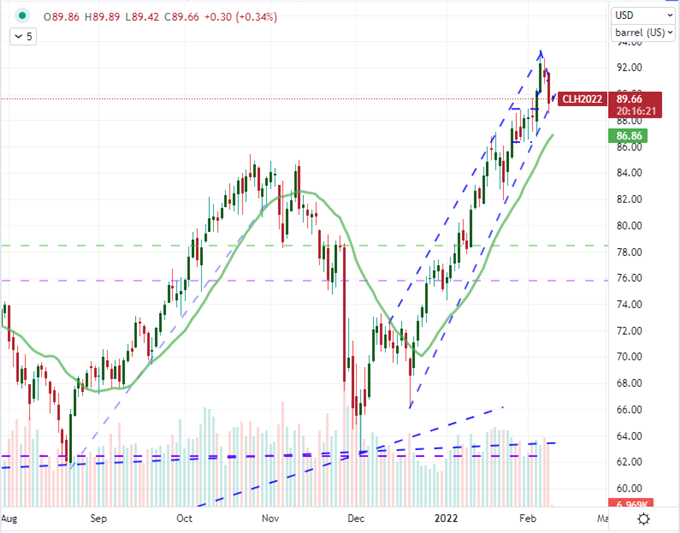
Chart Created on Tradingview Platform
Explicit Monetary Policy Updates are Still Off, but Rate Forecasts are Still Unfolding
While the risk of a serious escalation of geopolitical tensions over Ukraine is a global fundamental threat, the more reliable concern for financial markets is the trajectory of monetary policy. Interest rate expectations continue to swell across the board despite the lack of major central bank meetings or even key event risk that would provide overt milestones to mandates of inflation or employment. Taking a look at the short-term (I look to 2-year) yields for government bonds for the majors, there is a fairly consistent push to fresh multi-year highs. The notable exception is for the Eurozone where last week’s sharp rally has seen it bleed off altitude in this week’s calm. There is relative pricing potential here for the majors, but it is important to keep this general picture in mind when gauging global risk trends.
Relative Monetary Policy Standing of Major Central Banks
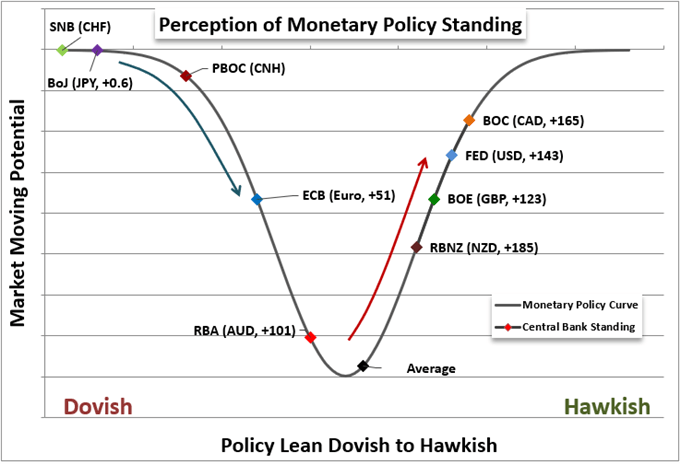
Chart Created by John Kicklighter with Data from Swaps
While there was a notable advance in the short-term yields for the likes of the UK, Canada and Australia this past session; the US charge was the most impressive in my book because it came with some fundamental encouragement. Having pushed as high as 1.34 percent, this short-end rate is the highest since pre-pandemic and up an incredible 8 consecutive weeks – the longest charge since January 2018. From the calendar, there was important data from the NFIB small business survey that reported the largest percentage of participants raising costs on their customers since 1974. Meanwhile, the fourth quarter household debt update signaled the biggest annual jump on record and a 14-year high overall in part due to the higher costs of big ticket items like homes and autos. Even earnings would point to the pressures of inflation with Chipotle signaling that it rose prices by approximately 6 percent – with the market happily absorbing the cost – and suggesting more could be on the way. That sets the stage for Thursday’s CPI well.
Chart of US 2-Year Treasury Yield and 5-Year US Breakeven Rate (Daily)
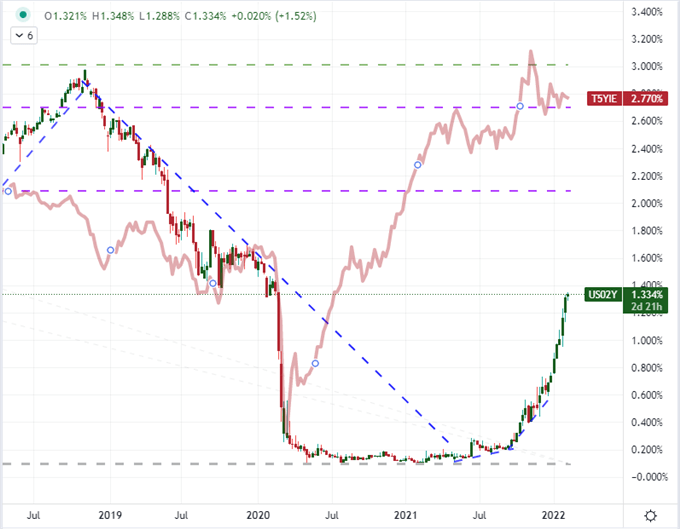
Chart Created on Tradingview Platform
An Outlier in Rate Forecast in Euro Pairs
I am of the belief that inflation expectations are pressing excessive levels – and interest rate forecasts are even more exaggerated. However, that extreme can persist for an extended period so long as there isn’t a fundamental catalyst to shift our momentum. Clearly, I see the US inflation report later this week as a possible pivot; but for the time being, the mere evolution of the trend seems to find little pressure to change tack. There is of course an exception in the Euro. ECB President Lagarde to start this week reinforced her message of dovish intent which the market seemed to judge she wavered on at last week’s rate decision. Yet, seeing a sudden jump in rate expectations for Europe (from 19 to 51 basis points from Monday to Friday) against such an overt language of dovishness has made it prone to questioning. That said, we have seen European (German) short-duration rates slip and cater to the technical boundaries present in EURUSD. Against 1.1500 resistance the fundamentals and chart seem to be aligning, however, the cautious may prefer to see 1.1400 support give way after the US CPI hits the wires for confirmation.
| Change in | Longs | Shorts | OI |
| Daily | -9% | -2% | -7% |
| Weekly | -15% | 37% | -2% |
Chart of EURUSD with 100 and 200-Day SMA Overlaid with German-US 2-Year Spread (Daily)
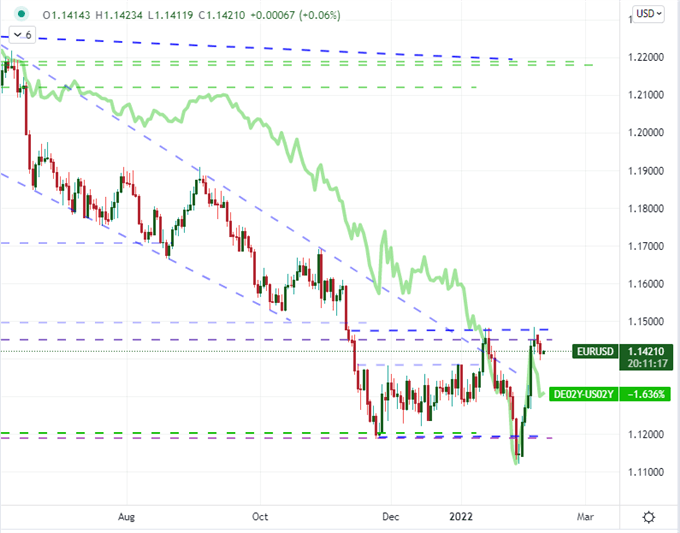
Chart Created on Tradingview Platform
While my attention is directly fixed on the FX market’s most liquid major, it isn’t the only Euro cross worthy of attention. There are a host of carry exaggerated crosses that would be prone to correction after last week’s charge, including pairs like EURGBP, EURCAD and EURAUD. That said, there is something to also be said for the crosses where the Euro has swelled relative to fellow ‘funding currencies’. EURCHF is more explicitly a reflection of European monetary policy, but EURJPY draws my interest for a dual role. Not only do we have the relative policy consideration to consider, but there is also the ‘risk trend’ sensitive of most Yen crosses. If there is any risk aversion that comes with a commensurate easing in aggressive rate expectations, this is perhaps the most ‘at-risk’ pair.
Chart of EURJPY with 100-Day SMA Overlaid with German-Japan 2-Year Spread (Daily)
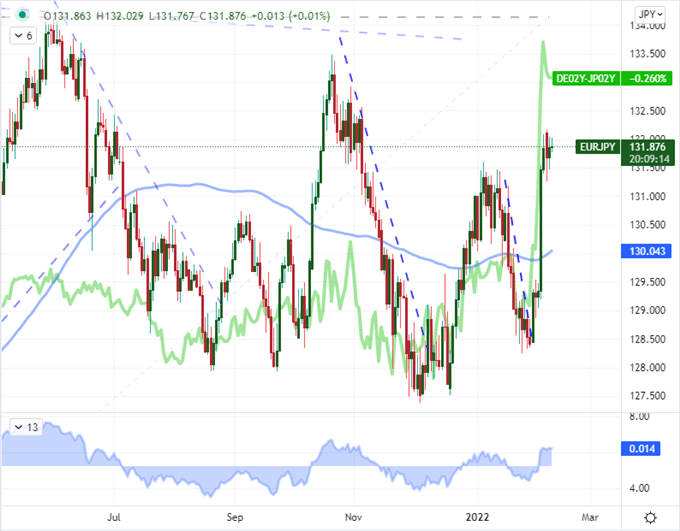
Chart Created on Tradingview Platform


