


QQQ Nasdaq 100 ETF, FAANGs, EURUSD and USDJPY Talking Points
- The Trade Perspective: QQQ bearish below 350; EURUSD bearish below 1.1500; USDJPY bearish below 113.75
- Though volatility was exceptional this past week, there wasn’t a clear trend to be found between soaring interest rate expectations and disparate earnings
- Rate forecasting remains the top fundamental theme for the week ahead, but scheduled event risk thins out – though we there remains certain key releases like US CPI
Trade Smarter - Sign up for the DailyFX Newsletter
Receive timely and compelling market commentary from the DailyFX team
Risk Trends Are Rocking but A Clear Bearing Still Escapes Us
We have passed through an exceptionally busy week loaded with heavy event risk that has stirred deeper fundamental waters (eg NFPs and the ECB rate decision), but there remains a lack of clear trend for risk-leaning assets. If a singular focus helps to determine a clear bullish or bearish bias from the financial system, the week ahead seems better positioned to deliver. However, I don’t believe a more targeted focus will resolve the debate unfolding across the global markets. More likely, a distinct trigger will come along and force the market to take a stance – and when that happens I will be ready. For now, I’m watching the hierarchy of risk trends. The US growth-to-value equities comparison (Nasdaq 100 to Dow) was ultimately unchanged through the week after an aggressive round turn. The Nasdaq 100’s failed rally and retreat would itself tally the biggest ‘upper wick’ at 502 points (12.1 for the QQQs) on record. More broadly, there was volatility to register in other corners of the speculative spectrum (global indices, junk bonds, carry trade, etc); but their technical footprint is less impressive.
Chart of QQQ Nasdaq 100 ETF with 20-Day SMA, Volume and 10-Day ATR (Daily)
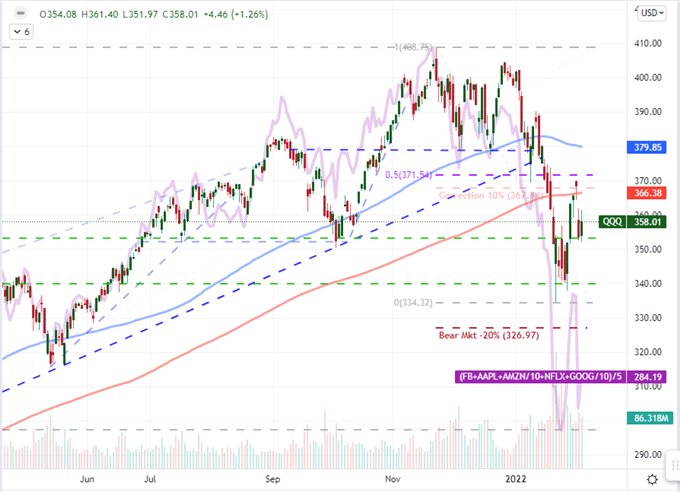
Chart Created on Tradingview Platform
Looking to the charts, there are plenty of technical boundaries to refer to, but there isn’t an overwhelming tipping point that leaves us clearly exposed to a firm fundamental push – whether scheduled or out of the blue. From a thematic perspective, interest rate speculation remains the top fundamental theme of interest carried over from this past week into the course ahead. Through the second half of the week we just closed, attention paid to interest rate forecasting hit extreme levels. The attention shouldn’t surprise given the reversal in stance from major central banks these past few months and the impact of certain event risk. Friday’s NFPs was just such a reading. The 467,000 net increase roundly beat the consensus forecast of a 150,000 rise, not to mention dispelled the ADP private payrolls print. That feeds into rate hike pressures, but at what point does that capsize excess risk exposure?
Chart of US Nonfarm Payrolls Change, ADP Payrolls Change and Difference (Monthly)
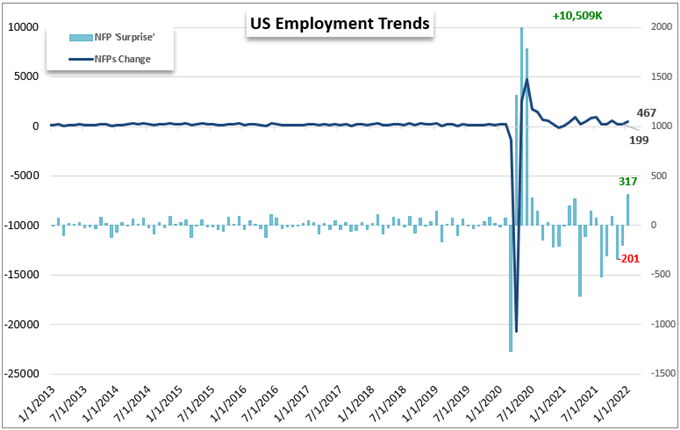
Chart Created by John Kicklighter with Data from the BLS and ADP
Rate Forecasts Are Hitting Ludicrous Levels
Between the strong US employment data and the upgraded inflation components of the recent ISM activity reports, the rate forecast for the Fed has soared. Depending on what product you refer to, markets are pricing in between five and six standard rate hikes (125-150bps) through year’s end. It will be very difficult to raise that end-of-year number at this point, but front-loading expectations could be the escalation of hawkish pricing. As of the week’s close, Fed Fund futures were pricing in a certainty that the FOMC would hike 25bps on March 16th, while the chances of a 50bp move rose to 32 percent. There are further three full rate hikes priced in through the end of June. This is extreme. While it is possible to live up to these expectations under extreme volatility, it is more likely that we see these views ebb – and likely the Dollar with it.
Chart of Amazon with Volume and After-Hours Change Overlaid with QQQ and Correlations (Daily)
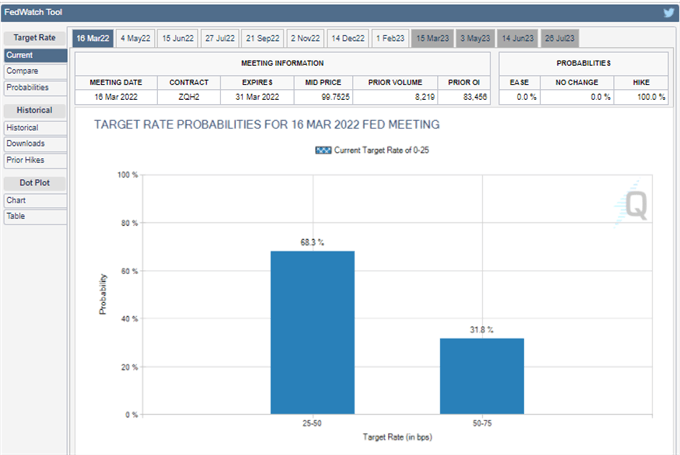
Chart Created on Tradingview Platform
I am keeping a close eye on the US interest rate forecast and the impact it has over the capital markets, but that is not the only outlet of speculation. The outlook has seen a hawkish advance across the major central banks this past week, with serious implications for risk trends at large. The Bank of England hiked rates 25 basis points (as expected) while the BOC, RBA an RBNZ projections all firmed. That said, the most impressive shift would come from the perpetual dove, the ECB. Despite the central bank’s protestations, the market upgraded its 2022 rate hike schedule from 19 basis points at the beginning of the week to 51 bps by its end (the ECB has been moving in 10 bp increments these past years). There is relative opportunism here, but there is also a fragile backdrop built upon the assumption of abundant capital availability.
Relative Monetary Policy Standing of Major Central Banks
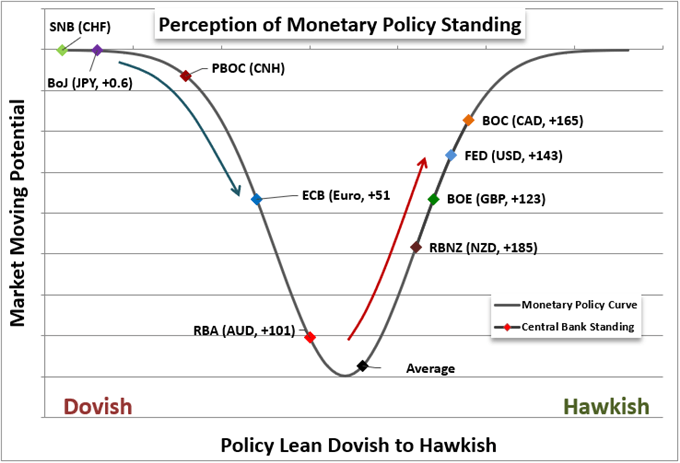
Chart Created by John Kicklighter with Data from Swaps
Top Watches for the Week Ahead
While I am going to be keeping a very wary eye on the capital markets over the coming week, risk trends don’t seem to be offering up a sense that we are ‘on the cusp’. I would like to think that sentiment is going tip one way or the other systemically any time now; but that is wishful thinking rather than proper trade preparation. If I’m following more explicit fundamental lines, it would seem that monetary policy remains the best matter to keep a close eye on for fundamental influences. EURUSD rallied back to 1.1450-1.1500 resistance to end this past week on the sudden reversal in the ECB rate forecast. While the European group’s perceived plans fall far short of the Fed’s, we hadn’t previously priced in that possibility. To further build up European yield favor would take a miracle not on the docket from Europe, but a US centric capital crisis is not that fanciful a threat consideration. I do believe a check lower against 1.1500 is a path of last resistance.
| Change in | Longs | Shorts | OI |
| Daily | -8% | 17% | -1% |
| Weekly | -2% | 11% | 2% |
Chart of EURUSD with 100-Day SMA Overlaid with German-US 2-Year Spread (Daily)
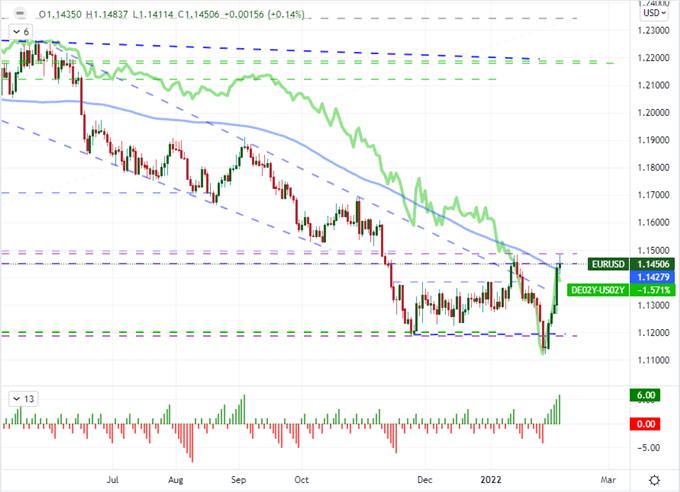
Chart Created on Tradingview Platform
Taking a look at speculative positioning, there is some severe positioning to take stock of. From speculative futures traders, recent EURUSD volatility seems to inspire little concern in the open market. Net positioning in this narrow corner rose to a net long 31.6 thousand contracts, but that suggests little in historical context. What’s more, the longer term horizon from that particular speculative crowd does not lend itself well to the average retail traders’ timeline. On that front, retail positioning measured by IG has shown an incredible reversal in net positioning this past week. From nearly 73 percent of EURUSD traders long to 37% in just a few days, there is some extreme volatility at work – not to mention a hunger for trades.
| Change in | Longs | Shorts | OI |
| Daily | -8% | 17% | -1% |
| Weekly | -2% | 11% | 2% |
EURUSD Overlaid with IG Client Sentiment Data (Daily)
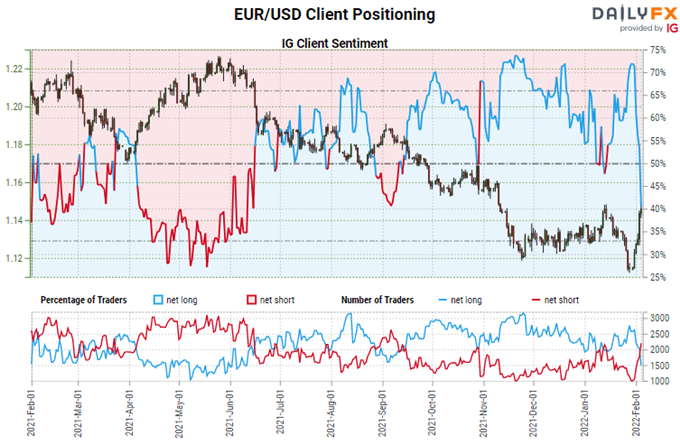
Chart Created on DailyFX.com
While EURUSD has both technical and fundamental appeal, it isn’t the only major player to consider in the week heading forecast. There is a lot of extreme policy contrast at work for this exchange rate, but the disparity between the Fed and BOJ is arguably even greater. A history of decades in stagnant inflation makes a clear foundation for a prolific dove. That said, this pair ends up representing a more siloed view of the Dollar. If Fed rate expectations falter – particularly if it happens alongside financial risk aversion – USDJPY will show both the impacts of speculative appetite and the bloated outlook for the US Dollar. My technical line in the sand is 113.75 for the moment.
Chart of USDJPY with 100-Day SMA Overlaid with the S&P 500 (Daily)
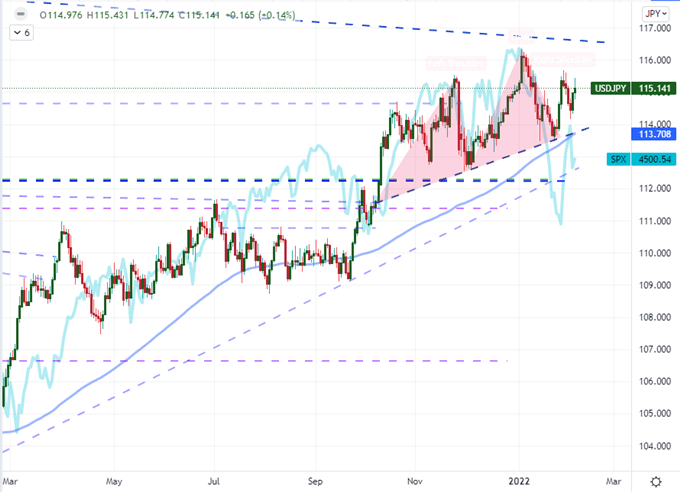
Chart Created on Tradingview Platform


