


S&P 500, Nasdaq 100, Dollar, AUDUSD and EURGBP Talking Points
- The Trade Perspective: Dow below 33,000 and/or Nasdaq 100 below 14,200; AUDUSD below 0.7000; EURGBP long against 0.8300 after ECB Decision
- Top fundamental theme ahead remains monetary policy with the ECB, BOE and RBA on tap; but there are alternative risks to monitor
- Aside from rate forecasting, growth and earnings are key matters ahead – crypto traders would due well to include the UK’s Sue Gray report and Ukraine to their watch list

Volatility without Commitment
Risk-leaning assets were sent on a ride this past trading week, but it was fairly clear that commitment through capital market assets would not be established before the weekend. That is a problem for those looking to employ a medium-term timeline on trade exposure that relies on some measure of follow through. Perhaps we will find a fundamental hold that urges traction more readily than the US monetary policy update this past week. To measure risk assets from the world’s largest market – a specific proxy for speculative exposure – we were treated to an exceptional level of intra-week volatility with meaningful framing for chart-based boundary. From the S&P 500 (below), a break above 4,450 would break from the ‘narrowest five-day range with the highest volatility’ since the pandemic. I will remind that volatility tends to be negatively correlated to speculative assets. If the indices hold or rise, it is more and more likely that volatility falters.
Chart of S&P 500 with 100 and 200-Day SMA and 5-Day ATR (Daily)
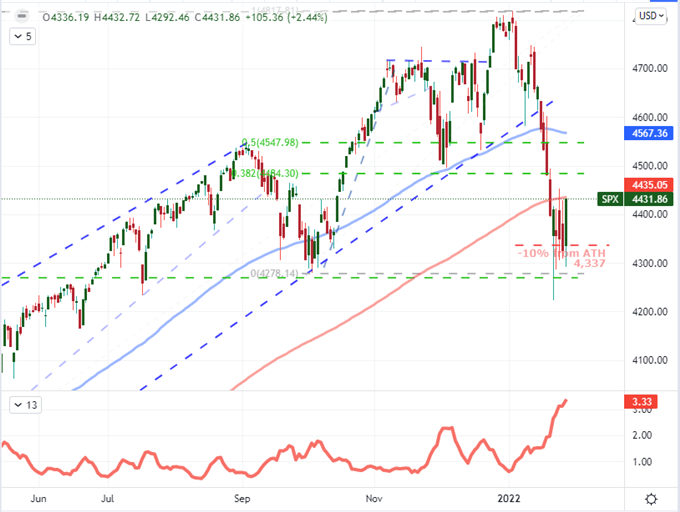
Chart Created on Tradingview Platform
As we weigh the intent of the global investor heading into the new trading week, it s important to point out that there was a meaningful retreat across the spectrum of ‘risk assets’. Different measures reported different performances, but it seems the message to ease back from exposure would prevail. That said, a correction is not necessarily a trend reversal. There is a very strong view of ‘buy the dip’ that will carry forward through traditional and unorthodox risk measures this past session. Seeing an outright tumble from the S&P 500 or Nasdaq 100 will likely necessitate a deeper tide change than what we have seen thus far, but there are early warning signs we can refer to in the meantime. Meme stocks, alt-coins, SPACs and other exceptional risk favorite over the past year are tame relative to the tech benchmark. That said, the Nasdaq to Dow (growth relative to value) has established far more tractions.
Chart of Nasdaq 100 to Dow Ratio with 100 and 200-Day SMAs (Daily)
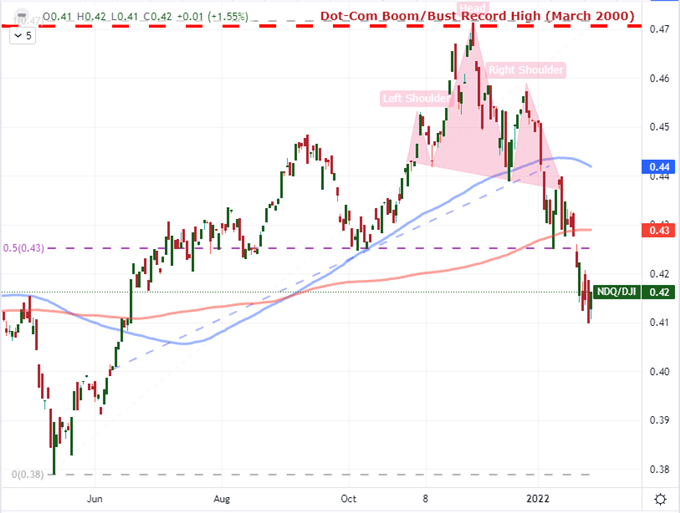
Chart Created on Tradingview Platform
What’s Ahead Next Week
If you are monitoring tangible fundamental drivers that could stir market volatility over the week ahead, you may very well be met with more high-level landmines than you have seen in some time. There are a few themes to monitor moving. There is explicitly a serious monetary policy forecast discrepancy, but the FOMC’s announced firming on a more aggressive 2022 monetary policy only stretched so far to this point. Outside of relative pacing for central banks, the docket ahead will turn interest in growth forecasts and earnings. Any one of the high-probability indicators could set the course risk for market, but beware of speculative pull.
Calendar of Top Macro Economic Event Risk for the Week Ahead
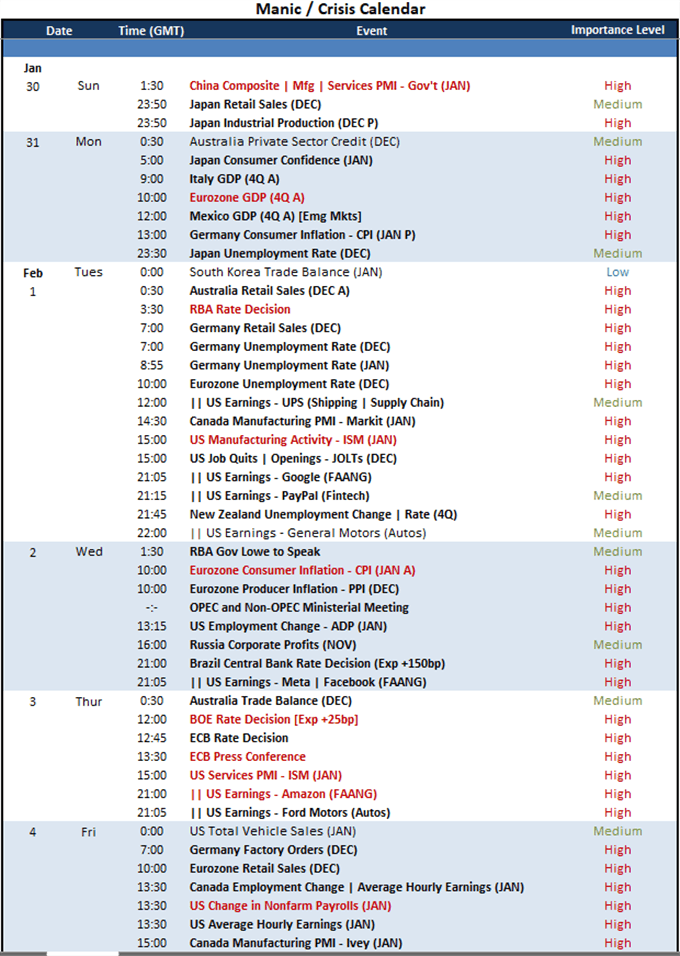
Calendar Created by John Kicklighter
In fundamental terms, earnings, growth and alternative matters will hit with a significant frequency; but that isn’t where I will be looking for trend motivation. At the top of my list of interest will be relative monetary policy . By week’s end, the markets were pricing in 126 basis points of tightening (for the Federal Reserve). Expecting a 5 standing increase pace from a previously dovish central bank seems impractical to me, which contributes to my mid-term views. After the rate decision and PCE deflator this past week, I’ll be watching for the ISM manufacturing and service sector activity reports (Tuesday and Thursday) along with the Friday NFPs. It is not clear whether the labor report will be interpreted as a growth or inflation insight, but it is likely to be volatility induing regardless. In contrast to these straight economic reports, the monetary policy interpretations of the Fed’s major counterparts will produce not-so-clear trajectories going into announcement.
Relative Monetary Policy Standing of Major Central Banks
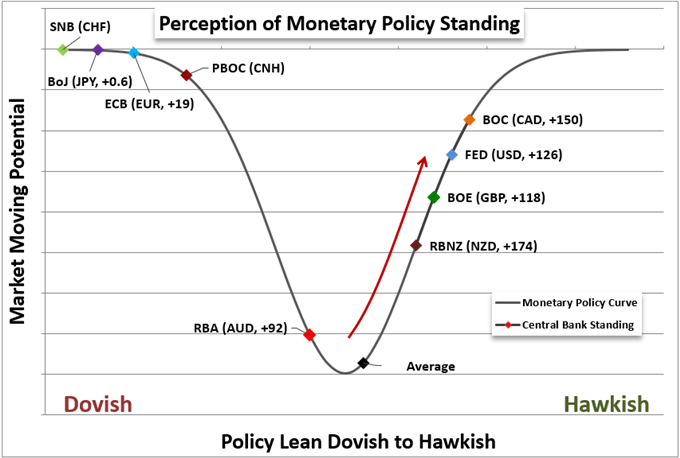
Chart Created by John Kicklighter with Data from Swaps
Markets are forward looking, so a more hawkish rate forecast for the market can imbue a significant sense of value for target currencies. The Dollar has certainly benefited a swell in interest rate expectations these past months – as its safe haven capacity has ebbed – with the swaps market fully producing anticipation for the European Central Bank (ECB); Bank of England (BOE) and Reserve Bank of Australia (RBA) due over the coming week. Sure, there can be a serious run for its money for the Dollar in relationship to these put-upon policy updates (Euro, Pound, Aussie Dollar), but my I see the markets as being far too hawkish on the US central bank. According to swaps, five standard rate hikes (+25 basis points) is fully priced in for 2022. I feel that to be excessive given the connection between interest rates in growth / risk trend performance. Among the majors, the Dollar may very well the most overt single drop this past week. The Greeenback (DXY Index) hit a new multi-year high, but it will be difficult to keep building their optimistic outlook.
Chart of DXY Overlaid with Implied 2022 Fed Funds Rate Change and 20, 60-Day Correl (Daily)
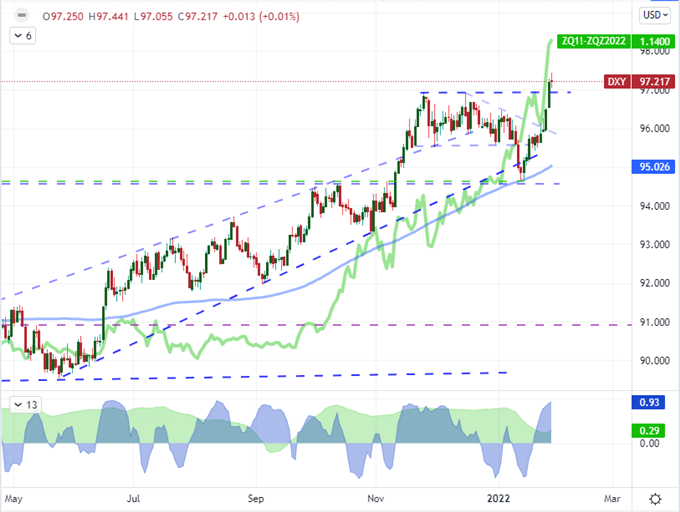
Chart Created on Tradingview Platform
Major Fundamental Pairs to Watch Over This New Week
First and foremost, attention is being fixed on the assessment as to whether global markets are committing to speculative interest and risk trends. Whether the Nasdaq 100 is breaking higher or lower, the view is important for the speculative reach. Working against a return to perceived normalcy (the ‘buy the dip’ mentality), is drying up for handhold milestones. Aside form the rate implications for the Fed via consulate, the ISM services, manufacturing activity report and January nonfarm payrolls update will give a US perspective. Outside of the US, there are three major central banks due to list: Tuesday RBA; BOE and ECB on Thursday. There is anticipation built into all of the currencies, but the ‘neckline’ on AUDUSD at 0.7000 indicate a reasonable watch list time for your views.

Chart of AUDUSD with COT Net Speculative Futures Positioning (Weekly)
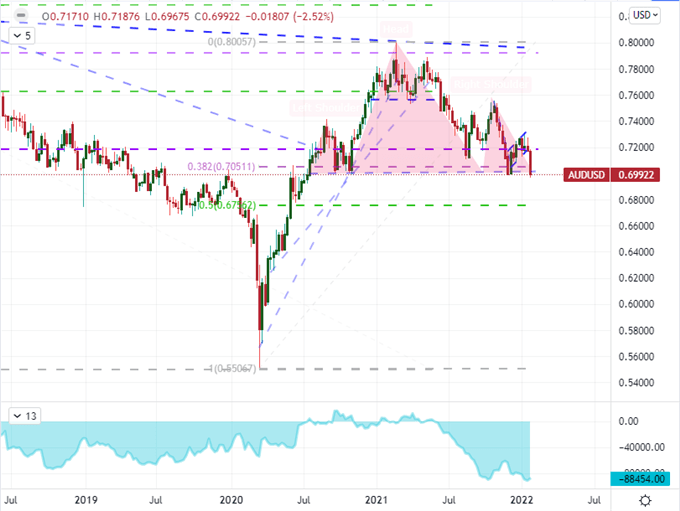
Chart Created on Tradingview Platform
Outside of the tight views of the capital markets wilderness, we still have reliable market data updates. Putting aside the Fed’s rapid adaptation via data, the Reserve Bank of Australia is pricing in a tepid 92 basis points of tightening through the year. Generally a debate of three or four hikes is a meaningful one, but are due bigger views ahead. The Bank of England (BOE) and European Central Banks (ECB) are set to announce on the same day. The views of policy intent for these authorities is both markets is paper thing. One way or the other, a head-wide range support at 0.8300 will offer some speculative opportunism on the EURGBP. I think a rebound is a more reasonable fundamental evaluation, but technicals certainly don’t hurt.
Chart of EURGBP with 100-Week SMA and Spot-SMA Disparity (Weekly)
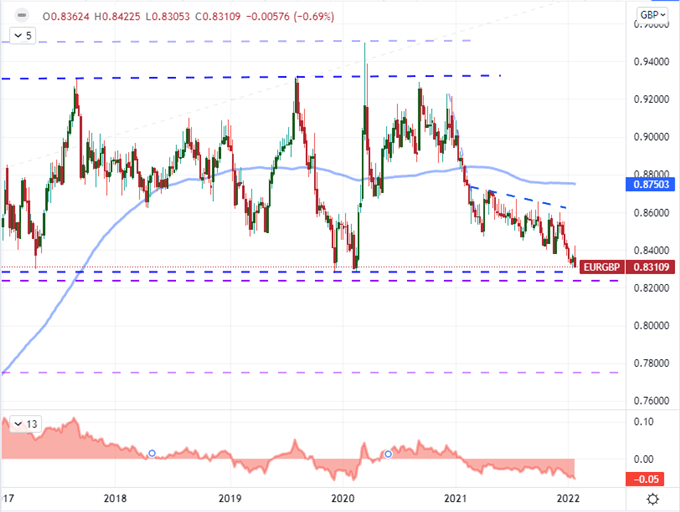
Chart Created on Tradingview Platform


