S&P 500, QQQ Nasdaq 100 ETF, Dollar and AUDCAD Talking Points
- The Trade Perspective: Bearish QQQ Nasdaq 100 below 350 after the Fed; Bearish Gold against 1,850; Bullish NZDUSD above 0.6750
- A sharp extension on last week’s S&P 500, Dow and Nasdaq 100 selloff turned into a record breaking reversal for the S&P 500
- The Dollar seems to have aligned to its traditional safe haven status, but conviction for the currency and risk trends should await the Fed…otherwise, markets are unstable


Monday Should be Assessed for the Extreme Volatility More than the Rebound
The opening session of the new trading week should move all traders to a state of serious caution. For the bulls, the reversal in the second half of the New York trading session Monday offers considerable relief – perhaps reflecting on the scale of hope that is directing our collective views rather than strategic positioning. It is ultimately the volatility that was more important to me through this opening session. Markets that are prone to extreme moves and sudden reversals can just as readily take a jog to the undesirable course with little warning as they do more favorable bearings. But that exposure tends to receive less attention when the dependency is founded on complacency and ultimately hope. If this level of volatility continues as we approach Wednesday’s FOMC rate decision, it will speak to a greater risk of instability in the markets that can handily override even the most universal event risk. To give some scale to the volatility, the S&P 500 opened to its worst gap lower since October 28th, 2020 and proceeded to tumble as much as - 3.99 percent at its trough. Yet, in the recovery that unfolded through the second half of the day, the index managed to recover all the lost ground and ultimately closer up 0.3 percent over Friday’s close. That leaves us with the biggest daily ‘lower wick’ (a measure of intraday reversal for this benchmark index on record (134 points).
Chart of S&P 500 200-Day SMA, Volume and ‘Tails’ (Daily)
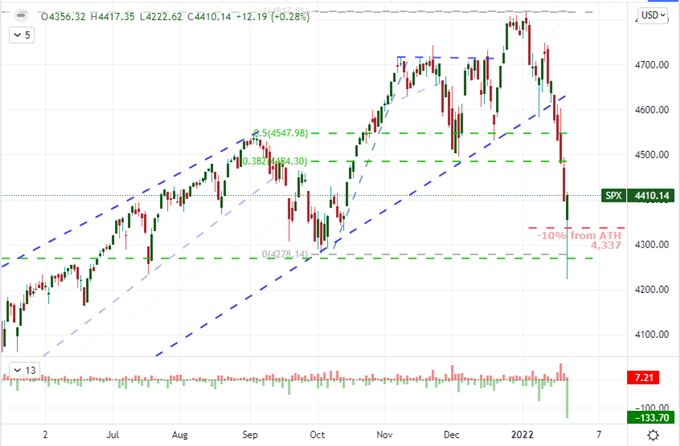
Chart Created on Tradingview Platform
Such a strong recovery from the S&P 500, Dow Jones Industrial Average and Nasdaq 100 can be viewed by the extremely bullish as the ‘buy the dip’ signal that they had been waiting for. While possible, a sustained climb ahead of the heavily anticipated FOMC rate decision on Wednesday afternoon would seem to severely undermine such an intention. Consider the scenario analysis from the central bank’s perspective. If the market’s are holding up well as you deliberate monetary policy after vowing to tighten the reigns faster than previously expected, it is reasonable to assume you can carry on with this intention with relative impunity. On the other hand, if the markets are threatening to throw themselves off the cliff if the world’s largest central bank throttles back on its support, the authorities would make a concerted effort to soften their tone. We have seen the market guide the US central bank’s policy hand a number of times over the years, so this should not be considered at all far-fetched. That said, speculators may not consider the game theory element – or simply the Fed’s perspective – in this equation. Certainly retail CFD traders who have driven their net long S&P 500 exposure to recent record highs aren’t thinking beyond their near-term personal opportunities.
Chart of S&P 500 with Net Speculative Positioning of IG Retail CFD Traders (Daily)
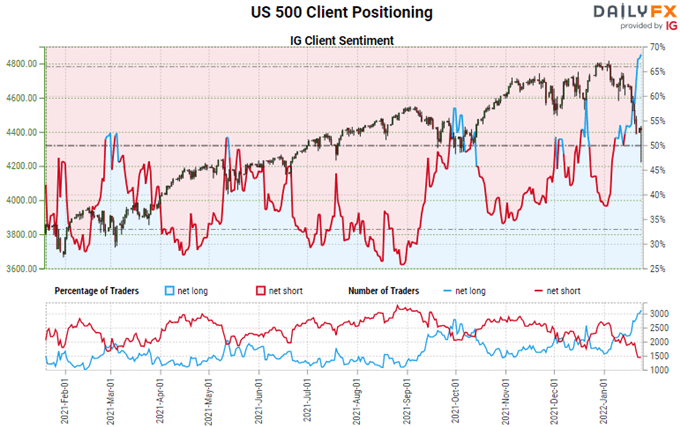
Chart Created on DailyFX
Volatility is Dangerous
Make no mistake: I love volatility. For my own purposes, more active markets means there is enough activity in the market that my preferred time frame for individual trades from two days to two weeks can generate reasonable swings in price action. However, there is a certain point at which volatility can be simply destructive and unpredictable – and thereby bad trading. I believe we saw just that this past trading session. Taking a look at the VIX volatility index, the so-called ‘fear gauge’ surged to its highest level in a year, eased off to leave the biggest intraday reversal since the height of the pandemic in February 2020 (volatility of volatility) on the heaviest volume since the same period. There was a reversal in favor of this asset class’s preferred bullish bearing, but how readily could this extreme flippancy work against the bulls? If volatility does not settle in the upcoming session in observation of the impending FOMC event risk – what is supposed to be the top fundamental theme and event risk – I would consider this market severely unstable and prone to an ‘accident’ in collective sentiment.
VIX Continuous Futures Contract with Volume and Wicks (Daily)
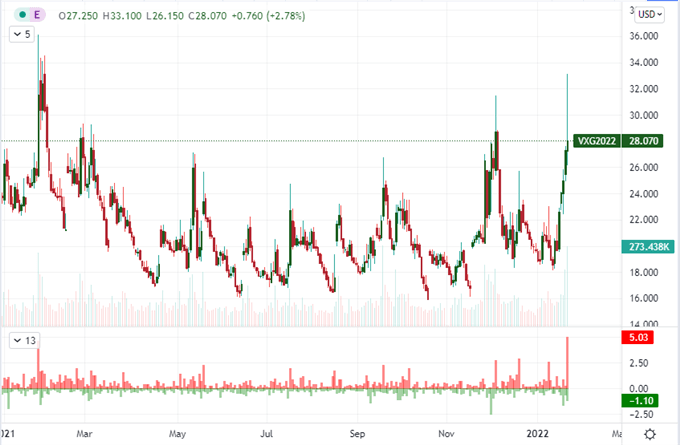
Chart Created on Tradingview Platform
The Fundamental Catalysts That Can Spark a Sensitive Market
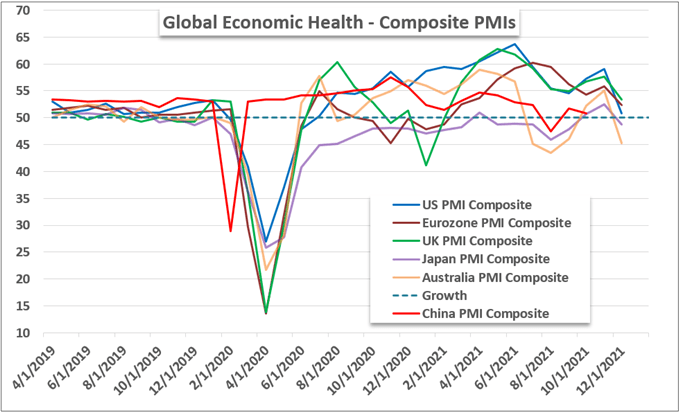
The first and greatest threat on my radar moving forward is the state of market activity and participation. Notably, turnover (volume) in ETFs hit a record high Monday of $460 billion which follows the second largest single share options expiration on record this past Friday ($1.2 trillion). That is an extremely active and sensitive market. That said fundamentals catalysts can still give a serious nudge to an already sensitive financial backdrop. While monetary policy is a singularly remarkable event with the FOMC on Wednesday, it isn’t the only game in town. General economic activity is another key theme. This past session saw the release of the January PMIs for the major developed economies and the picture was unfavorable – particularly against the backdrop of encouraging concerns through other outlets. Through Tuesday’s session, we will have a more comprehensive upgrade on global GDP via the IMF’s World Economic Outlook (WEO) update. It is very likely that the group downgrades its forecast given comments over the past week, but how will the market take the news.
Major Developed Economies Composite PMI Readings (Monthly)
Charted Created by John Kicklighterwith Data from Market IHS
The IMF’s views on economic activity isn’t the only high level event risk over the coming 48 hours. There is a particularly dense run of data around business and consumer sentiment for many countries across the globe. These groups’ views on growth, inflation, policy changes, covid and other influences on their wellbeing will not likely be favorable. In particular, I am monitoring the Conference Board’s US consumer sentiment survey, but it will likely hold limited impact on the Dollar and US capital markets unless it inadvertently triggers a serious fear over the course of the world’s largest economy. Earnings will also wade in to more important tickers reporting their performance from the previous quarter. General Election and Johnson & Johnson will cover the blue-chip perspective while Microsoft after the close will prepare us for Tesla and Apple due later in the week.
Calendar of Top Macro Economic Event Risk for the Week Ahead
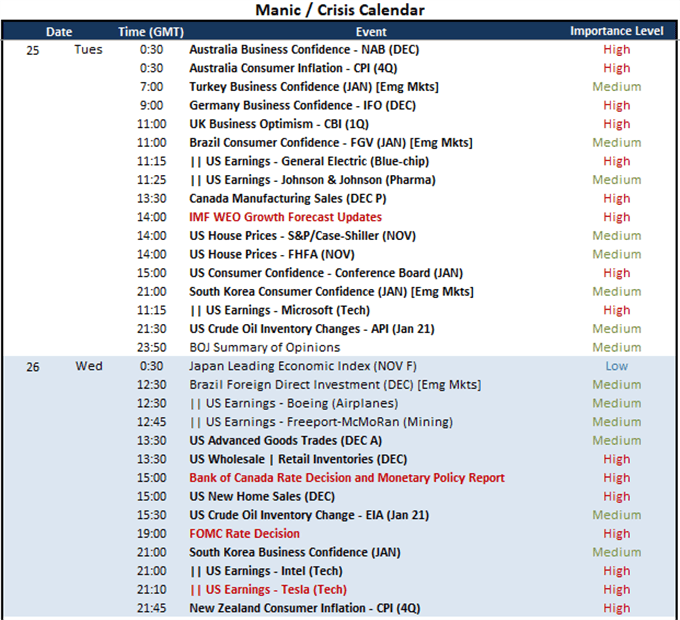
Calendar Created by John Kicklighter
While all attention should (rightfully) be on volatility and the assets most over-extended and thereby prone to serious troubles, I am also keeping a close eye on the US Dollar as a measure in between two worlds. Is it a carry currency (positive correlation to risk trends) or is it the classical safe haven everyone assumes from textbook explanations. It is definitely at the high end of the monetary policy curve with its peers with a strong correlation to interest rate forecasts from Fed Fund futures and the US 2-year Treasury yield. Yet an overlay of the VIX volatility index – showing a need for havens as it swells – shows the connection as well. I think it hasn’t resolved its commitment just yet. But when it does, it will be of greater interest. I’ll be watching pairs like NZDUSD which sees the RBNZ as an equally – if not more – hawkish policy stance to the current Fed perception and it isn’t due to weigh on rates this week (unlike USDCAD). I am also found of Gold for this same dichotomy, though gold is a lot less correlated to the risk moves we have seen lately – likely as it has been treated as a risk asset on and off over the past few years.
Chart of DXY Dollar Index Overlaid with 2022 Implied Fed Rate Change and 20, 60-Day Correl (Daily)
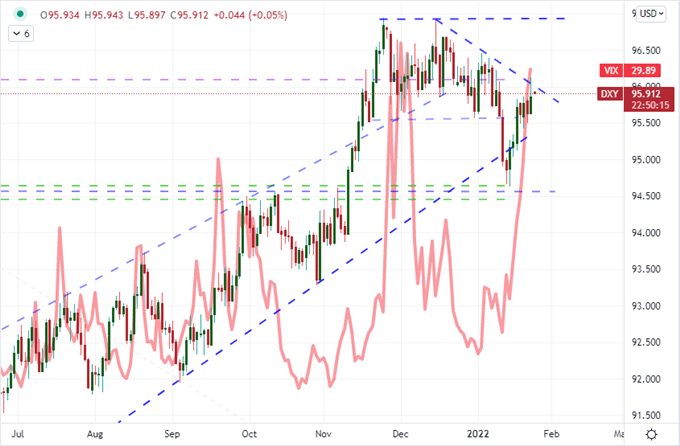
Chart Created on Tradingview Platform


