


Fed, Nasdaq 100, Dollar, USDJPY, GBPUSD and EURUSD Talking Points
- The ADP private payrolls doubled expectations and FOMC minutes echoed the hawkish views of the Fed from December
- US rate forecasts have grown to extreme levels with references to quantitative tightening and swaps pricing an 80% chance of a hike on March 16th
- Risk aversion has pushed the QQQ closer to a major reversal and the Dollar is primed for volatility as the ISM service activity report and NFPs are ahead to trigger more

I Thought the Fed Already Signaled Its Hawkishness…
Markets - and risk assets in particular - acted shocked Wednesday afternoon after the Federal Reserve released the transcript of its December monetary policy meeting. Though the central bank had already indicated its intent to take a more hawkish policy bearing with monetary policy anchored by a median forecast for three rate hikes through 2022, the reiteration after the liquidity swoon through the holidays seemed to extract a far more severe market response. US indices like the Dow and S&P 500 reversed from record highs with sharp losses – no move more impressive than the Nasdaq 100 which was already bearing lower form the previous session. Meanwhile, the Dollar registered a meaningful intraday rebound – though with the implications of any serious breaks. While there was some new reference to hawkish possibilities such as ‘some participants’ suggesting balance sheet reduction (‘quantitative tightening’) may be warranted soon after rate hikes started, the intensity of the outlook didn’t change much. Nevertheless, rate expectations did jump with Fed Funds futures pricing in a 71 percent chance of a hike at the March 16th meeting and swaps putting it closer to 80 percent.
Fed Rate Hike Probability for the FOMC’s March 16th Meeting
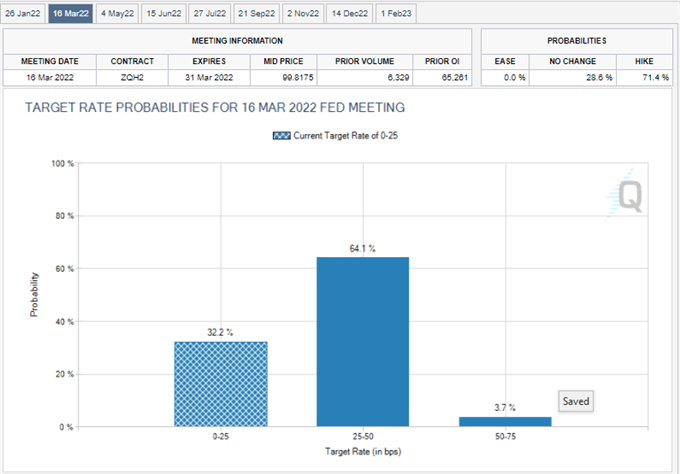
Graph from CME Fedwatch Tool
I personally think that is an impractically hawkish forecast. It is possible that the Fed is pressured to act that aggressively on its monetary policy rebalancing, but it would be a serious reversal of course for the group. Such dramatic changes from groups whose measured efforts are important for market stability would be a departure from the principals they have preached for years. From my perspective, we can see such a hawkish path and it is largely priced in from a yields and Dollar perspective – risk assets like indices are still too high for that path – or the outlook will moderate more in line with their typical approach. Nevertheless, the market is showing it is tuned in with the jolt of volatility to end this past session. We’ll need to see if it spread through Asia, Europe and back into Thursday’s US trading session. Given that my (admittedly small) poll in social media suggested most people were concerned the taper could prove the most pressing ‘grey swan’, it seems market participants are willing to panic if prompted.
Social Media Poll: What is the Biggest Grey Swan for Q1, 2022
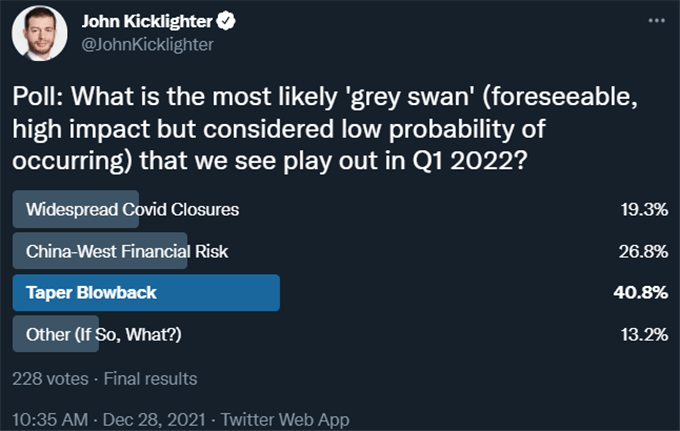
Poll from Twitter.com, @JohnKicklighter
Risk Trends are Still Stretched, Regardless of the Monetary Policy Focus
If the Fed intends to push forward with an aggressive monetary policy normalization – or more appropriately, if the market believes they will – there are a range of risk-leaning markets that are far too richly priced to absorb the withdrawal of easy money. While I could make the case for emerging markets and junk bonds among other assets, there are few benchmark assets more stretched in my view than US equities. While there is a serious amount of ‘je ne sais quoi’ investors have been willing to ascribe to the stock market, the previous ebb in categories like meme stocks and FAANG shows a worry that can prove more systemic. I am continuing to watch the relationship of ‘growth’ to ‘value’ via the likes of the Nasdaq 100 relative to the Dow. Yet, more broadly, if speculative favorite measure like the QQQ Nasdaq ETF further takes out its proximate 100-day moving average, it will readily crash into a multi-month range floor, a long-term trendline and be right at a ‘technical correction’ (a 10 percent retreat from highs). If that happens, fear will be more contagious.

Chart of QQQ Nasdaq 100 ETF with 100-Day SMA, Volume and 1-Day ROC (Daily)
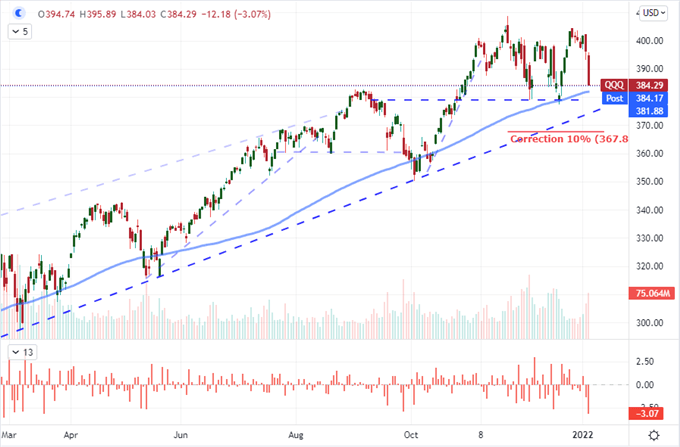
Chart Created on Tradingview Platform
Another risk measure to monitor is on the more unusual and distinctly retail side of the scale: Bitcoin. This is one of the most popular asset types of the past few years and it is just as exposed as the QQQ to pullback. However, the mystique around the cryptocurrency’s role in the financial system will meet a sudden rush of reality that could cause serious concern spread. Bitcoin has been described as a safe haven asset which seems to run counter to the heavy speculative interest behind the market. It has also been described as an inflation hedge and/or an alternative to flawed fiat like the Greenback. Yet, that appeal diminishes as the Dollar regains its traction – as BTC didn’t seem to take advantage when it had the inflation winds to its back. This is one to watch as it struggles to hold 44,000.
Chart of Bitcoin / BTCUSD with 50-Day Moving Average (Daily)
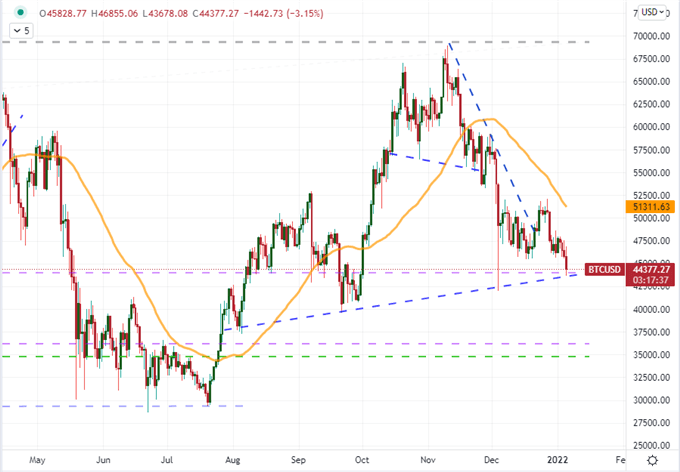
Chart Created on Tradingview Platform
Dollar: Having An Option for Different Outcomes
While there is a lot of pent up pressure behind certain ‘risk’ connections to monetary policy as a thematic driver, the Dollar is a much more sensitive barometer in the shorter term. While we need to ultimately wait for the market’s convictions to shift around the central bank’s intent to get an actual move, the upcoming service sector activity report (particularly its prices component) and the Friday payrolls report can certainly trigger the interest/fear. I don’t know how data report or how the market reads into it, so I would like to have options for different outcomes. Since I’m of the general belief that interest rate expectations are stretched, a pullback on forecasts leading to a pullback in the Dollar would seem best served for USDJPY. The pair is technically stretched (check out the weekly and monthly charts), but it also has the ‘risk trend’ response which could take over even if Fed rate forecasts simply level out for the Dollar.
Chart of USDJPY with 100-Weekly Moving Average (Weekly)
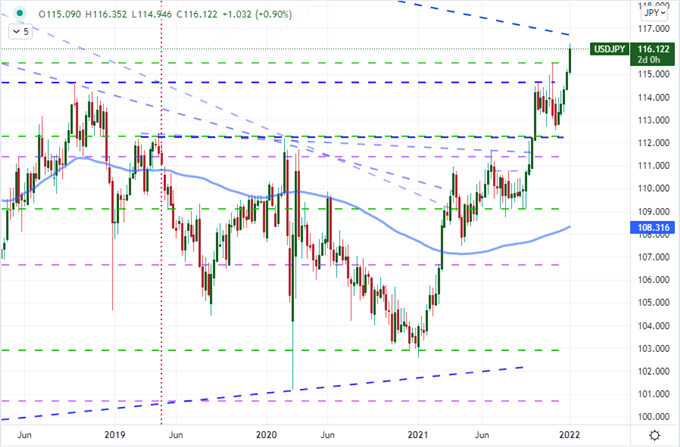
Chart Created on Tradingview Platform
For the alternative outcome – whereby the Dollar actually rallies with strong yield convictions – we need to look for a pair that is not already finding the Greenback stretched. That list is actually pretty robust, but I think the practicalities of the technicals for GBPUSD align nicely. Theis pair has drifted higher into a confluence of resistance around 1.3550/3600 which is the 100-day moving average, trendline resistance and Fib of the past year.

Chart of GBPUSD with 100-Day Moving Average (Daily)
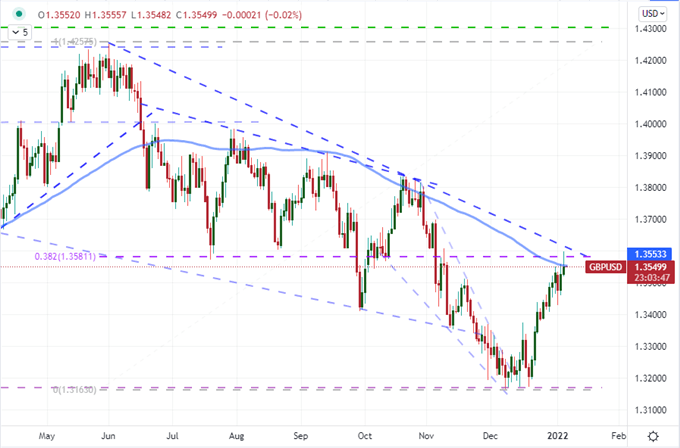
Chart Created on Tradingview Platform
And what if the outcome of the fundamental tumult is sheer volatility? For pure escalation for the Dollar, I will defer to EURUSD. This pair has seen an exceptional quieting over the past two months with a 35-day historical range hitting extreme (low) levels. Meanwhile, the level of activity over the same period, measured by the ATR (average true range) remains remarkably high. This is a strong candidate for a breakout without a bias towards direction, but arguments can be made towards the bearish with the ECB a dovish contrast or bullish if the Fed outlook is indeed overdone.
Chart of EURUSD Overlaid with 50 and 100-Day SMAs, 35-Day ATR and Historical Range (Daily)
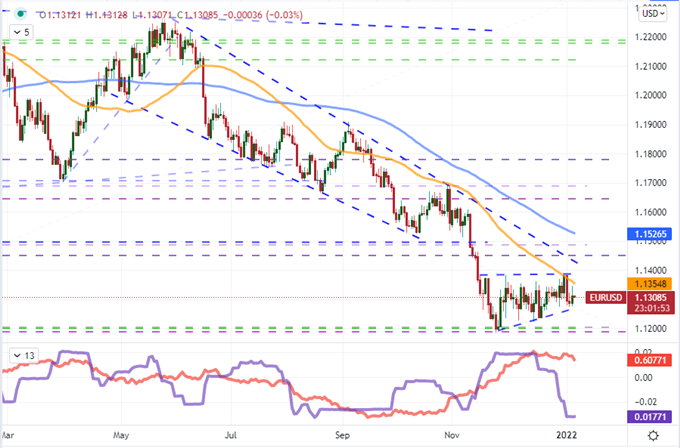
Chart Created on Tradingview Platform


