


Dow, S&P 500, Dollar and EURGBP Talking Points
- The opening day of the trading year found only a portion of the global markets online and what areas were trading were doing so on thinned volume
- A record high for a few of the US indices suffers the same question of confidence we ended last year on in trend development while the Dollar’s own rally seems more seasonally motivated
- As markets fill out in the days ahead, the docket will shift our focus back onto the traditional fundamentals with the ISM manufacturing survey from the US a first stop

An Uneven Risk Appetite to Start 2022
The confetti seemed to still be falling Monday as US indices extended the incredible 2021 climb for the asset class with a fresh record highs for both the Dow Jones Industrial Average and the S&P 500. Hitting that threshold looks remarkable in black and white print on the financial journals, but traders keeping tabs of the market backdrop and taking a casual look at the charts would remain less than convinced that we have slingshot higher to start the year. First, the charts. While on a close-over-close basis, both the Dow and SPX may have earned the distinction of a new peak; there is technical overhead like December 30th’s swing high for the former. More troubling is the uneven reflection of ‘risk appetite’ across different regions and asset types. Rest of world equities (I prefer the VEU ETF) is still trading 5.5 percent off its own high. Emerging markets (eg EEM), junk bonds (eg HYG) and commodities like crude remain far from their own peaks. Meanwhile, carry trade actually faltered through Monday’s session – though pairs like EURJPY, GBPJPY and AUDJPY are rallying into Tuesday’s Asia session.
| Change in | Longs | Shorts | OI |
| Daily | 1% | 3% | 2% |
| Weekly | 8% | -12% | -4% |
Chart of Dow Jones Industrial Average with 20 and 200-Day SMAs (Daily)
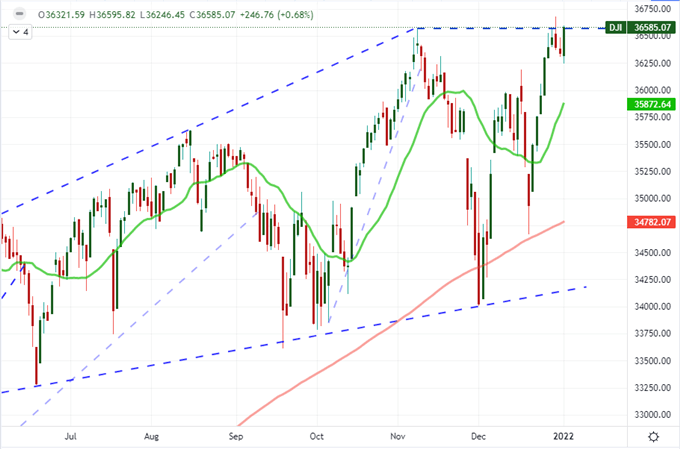
Chart Created on Tradingview Platform
Ultimately, my principal concern around the intent of the market’s uneven appetites is the backdrop for liquidity. This past session saw much of Asia offline and a number of European and American countries also observing the weekend New Years day holiday on Monday. Where markets were open, there was still an unmistakable curb on volume and open interest. Turnover for the S&P 500 SPY ETF, crude oil and Treasury futures was still running at levels commensurate with the past two weeks’ holiday activity. A slow pick up to the year is part of the seasonal assumptions. Volume and volatility derived from the S&P 500 show that the opening week of the calendar year takes time to thaw which ultimately contributes to the averaged performance of the underlying index through the same period. Historically, the opening week is the strongest for the US index; and there are so far no active systemic threats for which the market is actively fleeing which would suggest 2022 will be pushed as an outlier year.
Average Weekly S&P 500 Performance by Calendar Week
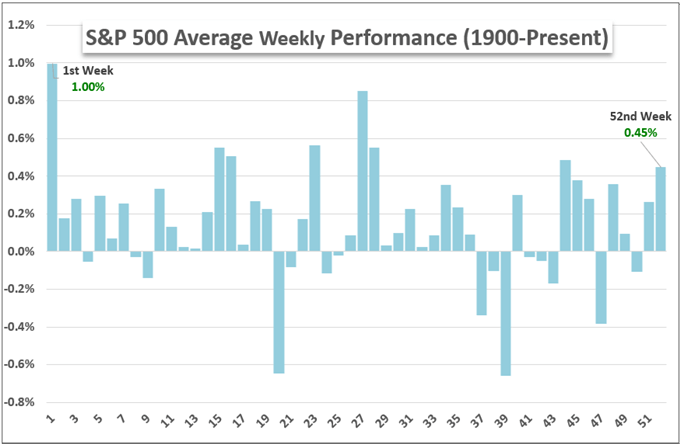
Chart Created by John Kicklighter with Data from S&P 500
The Speculative Outliers: Apple and Tesla
As remarkable as the Dow’s record high may be, its tempo was still extremely underwhelming. When liquidity is an encumbrance, it can be a universal one. Many of the 2021 favorites for retail speculative appetites are struggling entering the new year. Meme stocks like the GameStop and ETFs like BUZZ were treading water, the top cryptocurrencies are struggling for altitude, SPACs have cased and even the tech appetite is tepid with the Nasdaq to Dow ratio struggling. Two stand outs to start the year though had very prominent means for concentrating traders’ attention. Apple shares rallied 2.5 percent on marginally higher volume to hit a record encouraged by the reports that the company was the first public listing to hit the previously-unthinkable $3 trillion market cap (intraday). Meanwhile, newer tech-favorite Tesla posted its biggest single-day rally (13.5 percent) in six weeks after reporting far-greater deliveries in Q4 than were anticipated. These are impressive milestones, but not likely to lead to certain follow through on these individual tickers – much less for the market-at-large.
Chart of Apple Overlaid with the Company’s Market Cap and Volume (Daily)
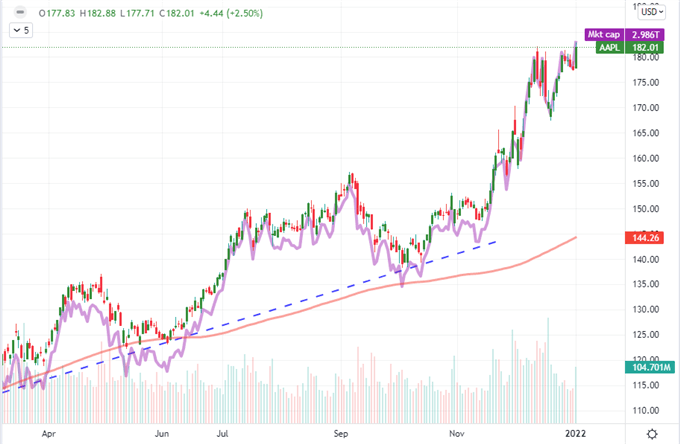
Chart Created on Tradingview Platform
The Dollar’s Rally Is More Digestible but Just as Suspect
US indices weren’t the only markets making headlines in otherwise quiet conditions. The Greenback earned a leer of its own from FX traders. The DXY trade-weighted Dollar Index rallied 0.6 percent for the second biggest single-day rally in two months. We have seen similar moves from this index not translate broadly to performance across the majors, but this isn’t one of those instances. The Dollar gained ground against the British Pound, Japanese Yen and Australian Dollar among other pairings. Of course, the EURUSD’s own reversal from 1.1385 was the most technically impressive; but most of the pairs ultimately registered the same thing: a push back into range. The two months-congestion is unmistakable through the DXY and EURUSD, but it is also there in form with most of the other pairings. That is fitting as pullback into range isn’t the charged speculative assumption that a Dow record high would insinuate. Here, the redistribution of capital among funds that occurs during the beginning of the year is an inevitable practice – and critically one where few read into improbable trends. Now, if EURUSD clear 1.1400 – 1.1200 or the DXY 97.00 – 95.50; my interest will certainly shift materially.

Chart of DXY with 50 and 100-Day Mov Avgs, 1-Day Rate of Change (Daily)
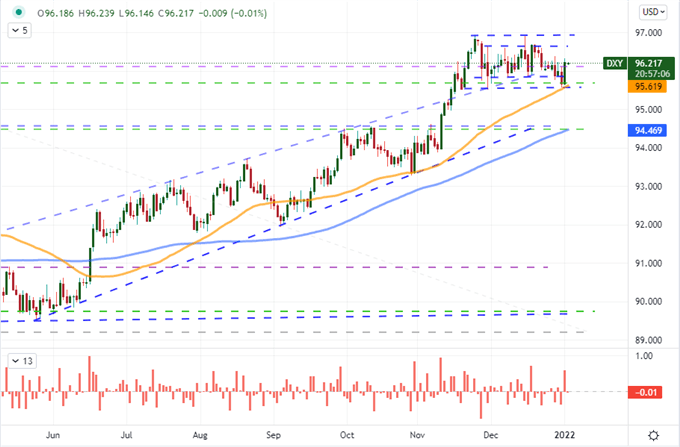
Chart Created on Tradingview Platform
Something that will help the Dollar – and Euro and Canadian Dollar – generate a little more potential friction is the scheduled event risk on the economic docket. This week holds a range of listings that have both remarkable standouts (like Friday NFPs) and those that are part of a theme (such as the range of manufacturing PMIs or early US corporate earnings). For Tuesday’s top listings, I will be watching the US ISM manufacturing report as a reflection of the world’s largest economy as speculators try to glean a clearer timeline on the first Fed rate hike. Canada’s own factory activity report will represent its own interest, but USDCAD is likely to differ to the US data point unless they tend to both align. One stretch of data that I believe should not be overlooked is the German unemployment change and retail sales reports. Europe’s largest economy has struggled with a resurgence in Covid cases and the ECB’s leadership has very prominently kept the dovish breaks on. Assumptions will be roused through this data. EURUSD is on my radar, but I like EURGBP as a more targeted candidate for the European data.
Chart of EURGBP Overlaid with German-UK 10-Year Yield with 10 and 60-Day Correl (Daily)
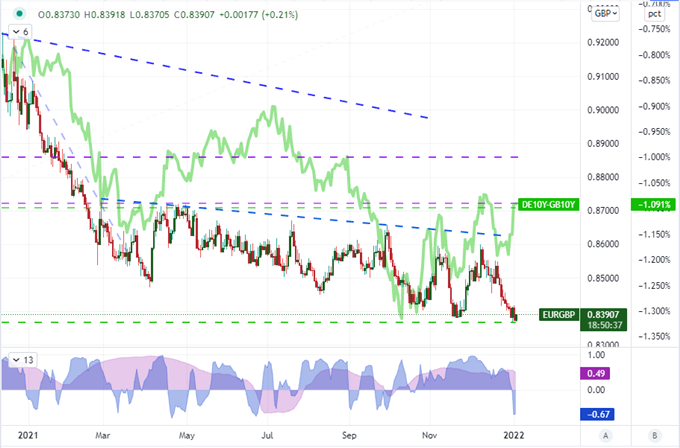
Chart Created on Tradingview Platform


