


S&P 500, ‘Risk’ Assets, VIX and EURUSD Talking Points
- While the S&P 500 notched its first decline in five trading days, it is still just off an all-time high – the Dow and Nasdaq 100 meanwhile have stalled before their milestone
- An extreme contrast between the Dollar’s 30-day historical range and its volatility (ATR) suggest a break is ahead, but probably not this week
- Liquidity is my top concern for evaluating what to trade and how this week; yet matters like Covid, China-West relations and monetary policy fallout should be monitored

Not Everything Risk-Oriented Has Notched a Record High
As recently as last week, I was worried that we would not see the vaunted Santa Rally this year as the markets stewed in their excess with a perspective of the lingering systemic threats in the open system. That said, we have definitely seen the late-stage bullish rally take place through Monday’s sharp rally. The four-day charge managed to push the S&P 500 to a record high, but most other risk-leaning benchmarks were still shy of the high water mark. When the momentum would have been most fruitful through this past session, the thinning speculative waters seemed to trip up momentum. For the broad US index, the first bearish day in five sessions would register a very modest -0.1 percent slip. That isn’t too worrisome. However, the loss of traction for the likes of the Dow Jones Industrial Average and Nasdaq 100 are more technically provoking as they are staged just below their respective record highs. These are not kind of conditions for breakouts of this magnitude – especially if there is any assumption of follow through.
| Change in | Longs | Shorts | OI |
| Daily | 6% | -5% | 1% |
| Weekly | 7% | -10% | -2% |
Chart S&P 500 with 100-Day SMA, Volume and Net Spec Futures (Daily)
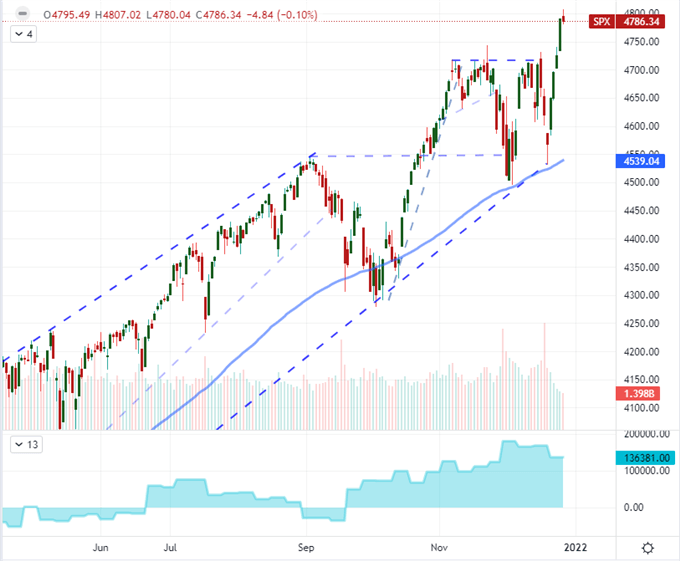
Chart Created on Tradingview Platform
The implications aren’t just for the US equity indices. A wide range of risk assets have flagged this past session and they do so far from their own historical highs (whether multi-month, year or record). Carry trade through pairs like AUDJPY, junk bonds (I monitored HYG), emerging market assets (here EEM) and equities for the rest of the world all edged back this past session. A bullish outlier from my normal range of assets to monitor was crude oil’s fifth consecutive daily advance. While a modest advance for the day, it extends the longest run in 10 months. On the opposite extreme of performance, Bitcoin lead with risk aversion with a -6 percent drop that was reflected across cryptocurrencies. I believe the former was feeling some of the carry through of inflation and the latter the hallmark further concentrated speculative appetite.
Chart of Relative Risk Asset Performance for December (2 Hour)
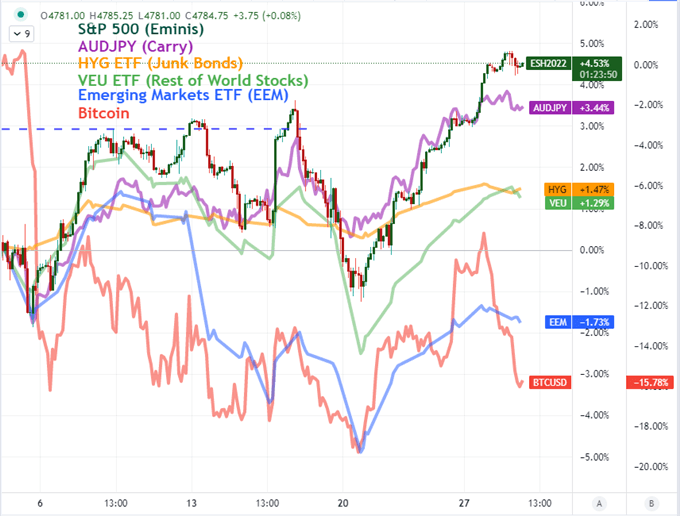
Chart Created on Tradingview Platform
Liquidity Remains My Top Concern and It Should Be Yours as Well
As we move into the second half of this final week of 2021, I am putting an even greater emphasis on the influence of liquidity. Historically, we expect volatility levels to continue to deflate into the twilight hours of a calendar year. The VIX volatility index is indeed deflating further while the ‘volatility of volatility’ VVIX measure is similarly sliding. I would also point out that the short-term VXX volatility ETF has pushed to a fresh record low. It is very reasonable to expect it to continue its drain, but don’t forget that thinned liquidity can lead to sudden – if short-lived – bouts of high volatility.
Average Weekly VIX Performance by Calendar Week
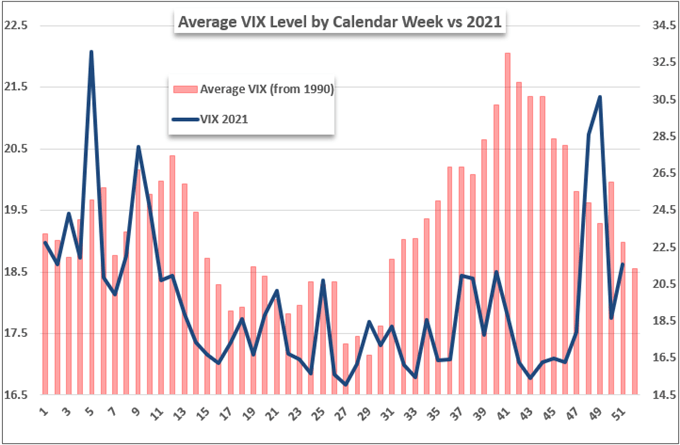
Chart Created by John Kicklighter with Data from S&P 500
As far as performance goes in the curb on volatility, the assumptions of lower activity equating to lower risk often push speculative assets higher. Historically, the final week of the trading year is the 7th best over the entire 52 year stretch dating back to 1900. The S&P 500 is the source of this study and it is already well in the green after Monday’s charge. However, when the benchmark is already pushing a record, a crawl higher is not as easily achieved.
Average Weekly S&P 500 Performance by Calendar Week
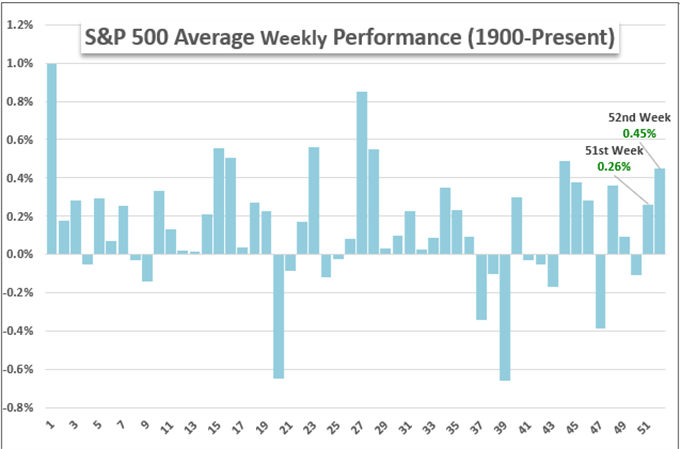
Chart Created by John Kicklighter with Data from S&P 500
A Dollar Breakout…Next Week
With a week of momentum in capital markets and a few high profile measures earning their own technical breaks, expectations would naturally run high for the world’s benchmark currency to follow in concert…any day now. Representing the home of outperforming indices and focal point for normalizing monetary policy, the US Dollar would seem a viable candidate for a breakout of its own. Instead, the currency has traced out a distinct triangle/flag that establishes a particularly narrow 30-day historical trading range. That alone wouldn’t be a point of interest or concern if not for the fact that the level of realized volatility (ATR) over the same period remains exceptionally high. That is a volatile cocktail for a technical break, but earning that move this week is just as improbable as it is with any other measure. Further suspicion should be raised considering there are few other majors that look as pristine a technical candidate as EURUSD.

Chart of EURUSD with 100-Day SMA, 30-Day ATR and Historical Range (Daily)
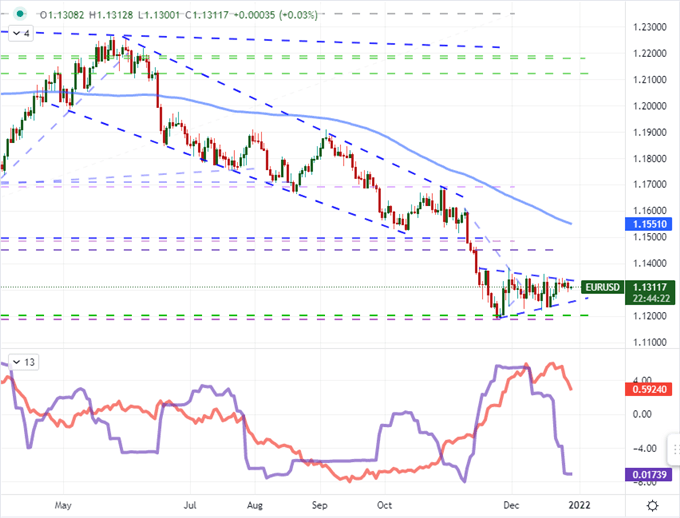
Chart Created on Tradingview Platform
While I will almost always place the influence of liquidity above any other fundamental or technical consideration, it pays to keep track of the most prominent candidates on these analytical dynamics. The economic docket remains remarkably light with only a European lending and US trade stats registering at all on my radar. Instead, I’m following the development of the open-ended risks. In my poll this past session, the top concern for Q1 seems to be blowback from central banks’ slowly reversing loose monetary policy. While that is a major point, for this week in particular, I would put far more weight behind surprises that arise around the omicron variant shutting down economies or China’s financial troubles through Evergrande or bad loans in general proving more urgent matters.
Chart of Key Google Trend Search Interest for ‘China’, ‘Stimulus’, ‘Omicron’ and ‘Fed’ (Daily)
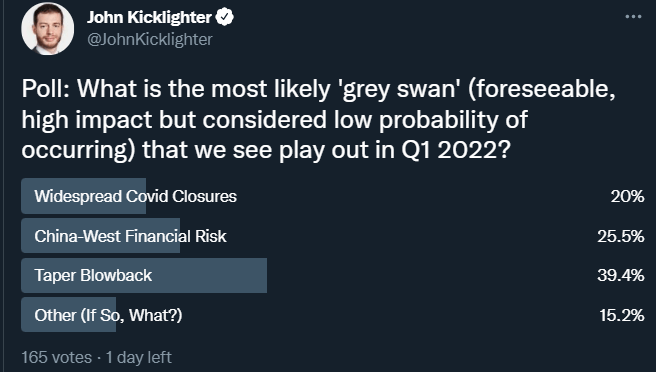
Chart Made on trends.google.com


