


S&P 500, Tesla, Nasdaq, Dollar and Inflation Talking Points
- Risk appetite was a mixed back this past week as tactical speculative interests compete against seasonal expectations
- While the S&P 500 is my gold standard for single-look risk appetite, Tesla represents the heady combination of market cap weight, thematic disruptor and Reddit board favorite
- Among the fundamental themes that can steer the market-at-large, attention looks as if it will remain fixed on inflation

Risk Trends Are Wedged Between a FOMO Bid, Seasonal Expectations and Fundamental Winds
Sentiment was a mixed bag this past week, and unless there is a strong speculative drive born of event risk ahead, the coming week may find the markets continue to struggle. This S&P 500 managed a bullish close through Friday’s session to pull us out of a possible bearish rollover. That said, we would still end up with the first bearish week for the index in six. That would match two other rallies (through Aug 24th, 2020 and December 23rd, 2019) with mixed resolutions. As we move deeper into November, seasonal expectations will increasingly disrupt progress like a fog blocking out troubling fundamental themes or a genuine resurgence of speculative appetite. The kind of short-term opportunism that supports themes like FOMO (fear of missing out) is likely to take be the default gear the markets keep to unless something more pressing develops.
| Change in | Longs | Shorts | OI |
| Daily | 2% | -7% | -3% |
| Weekly | 18% | -19% | -4% |
Chart of SPY S&P 500 ETF with 20-Day SMA and 1-Day Rate of Change (Daily)
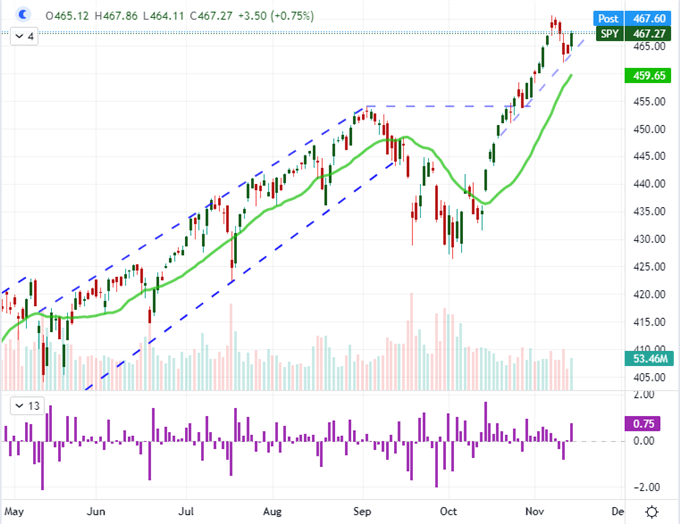
Chart Created on Tradingview Platform
Gauging the bearings of an all-encompassing risk trend is a tricky business. Technical developments have just as readily seen momentum fizzle out while high-profile event risk has frequently met a disinterested investor rank. That is not to mean that these analytical methods have been permanently cast aside, rather the markets are actively setting their collective priorities. That said, I believe fear to be one of the most violent and volatile influences that can arise. While the S&P 500 is still a good threshold gauge and correlations across an array of unrelated assets is the most dependable reading, I think it is worthwhile to keep tabs on the markets that are at the peak of speculative appetite to offer an early warning signal. Tesla will be a top ticker to watch from this macro perspective as it is a top market cap stock, a heavy player in the outperforming US tech sector and it is a frequent Reddit board favorite.
Chart of Tesla with Volume Overlaid with the Nasdaq 100 to Dow Ratio (Daily)
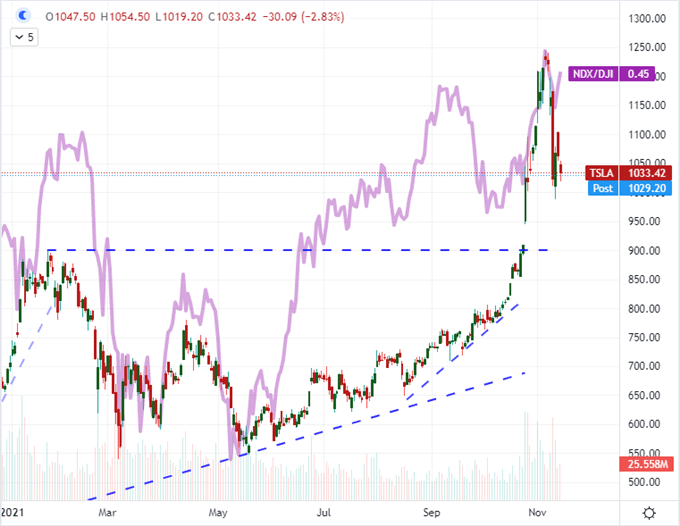
Chart Created on Tradingview Platform
What Fundamental Weather is on the Forecast?
This past week, there were various themes competing for our attention; but it seemed inflation – and the implications for monetary policy – bubbled to the top for market influence. I believe that will continue to be the dominant driver given the traction in search and headlines (see below), the schedule of central bank speak, subsequent rounds of inflation data and the volatility behind rate products.
Chart of Google Search Trends Worldwide for ‘GDP’, ‘Stimulus’, Earnings’ and ‘Inflation’
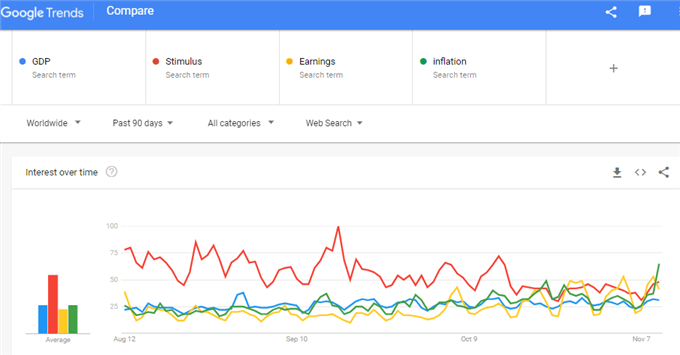
Chart Created with trends.google.com
Through this past week, the global forecast for interest rate expectations seemed to slow – which would also set the persistent hawkish US outlook in deeper relief to support the US Dollar. A hawkish monetary policy backdrop is still a threat to capital market assets – particularly those that are fundamentally stretched – but 2015 taught us a lesson. If only a few key players actively retreat from extreme accommodation, funds can simply shift into the other deep pools still sporting zero or negative rates and steady asset purchases. The 12-month rate forecast for the Bank of England, Bank of Canada and Reserve Bank of Australia notably dropped over the past few weeks. That shift has also curbed the nascent expectations for the European Central Bank to tackle its own inflation before 2023. The Fed and Reserve Bank of New Zealand can still pursue tightening without its peers, but their influence will be stunted and their pace will be slowed without camaraderie.
Chart of Perception of Relative Monetary Policy
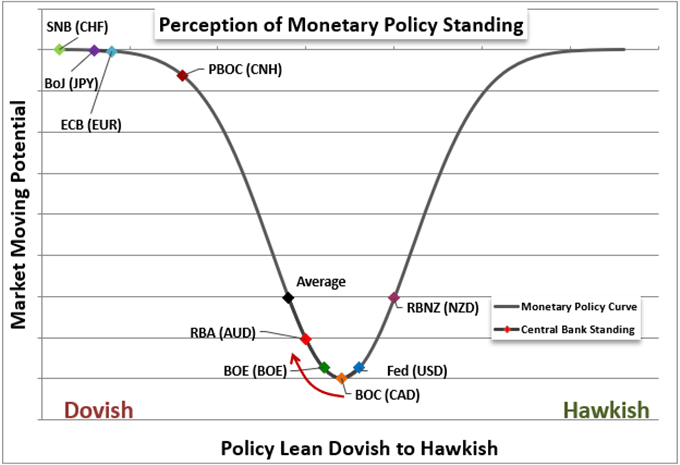
Chart Created by John Kicklighter
In a market with a propensity for slipping into complacency, traders will naturally look for the outliers. The second wind in Fed interest rate expectations can provide just such an stand out. Though the outlook for Fed hikes measured through Fed Funds futures and Treasury yields peaked and retraced around the November 3rd FOMC meeting, we have seen a new record high forecast in US rates projections through this past week. Through Friday, the implied yield change through Fed Funds futures rose to 57 basis points (a certainty of two full 25bp hikes and speculation of a third). What’s more, this time around the Dollar seems willing to follow along with the advance on a 20-day correlation that has flipped back to the positive. The 94.50 break was meaningful for the DXY, but the midpoint of the past 20 year range is still in place around 95.65.
Chart of Dollar Index with 100-Day SMA Overlaid with Implied 2022 Fed Funds and 20-Day Correl (Daily)
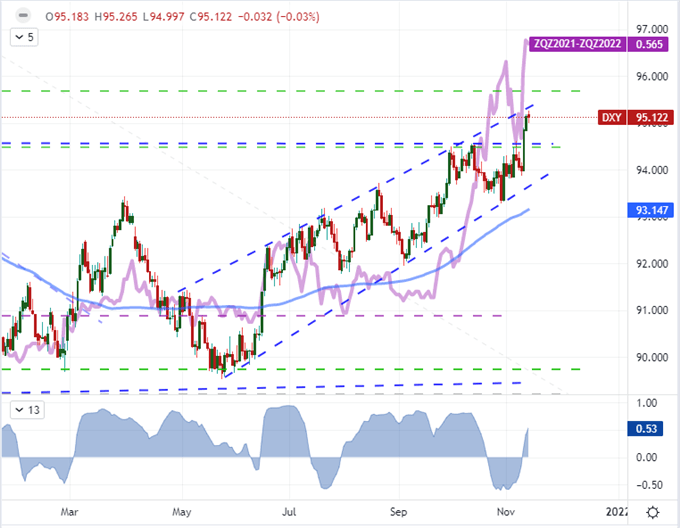
Chart Created on Tradingview Platform
Top Event Risk and Unusual Candidates for Market Movement
Taking a closer look at the macroeconomic docket for more concentrated catalysts, there is plenty of capable data on hand. Setting aside the inflation and central bank speeches mentioned above, the next most prominent theme in economic terms is consumption. We are due retail sales figures from China (Monday), the US (Tuesday), the UK and Canada (Friday) among others. Earnings will be another possible unexpected volatility spark with numbers due from the likes of Walmart, Home Depot (Tuesday), Baidu (Wednesday), JD.com and Alibaba (Thursday). If all of this data should conform to a distinct bullish or bearish course, it could wrest control of broader risk appetite.
Calendar of Major Macro Event Risk for the Week
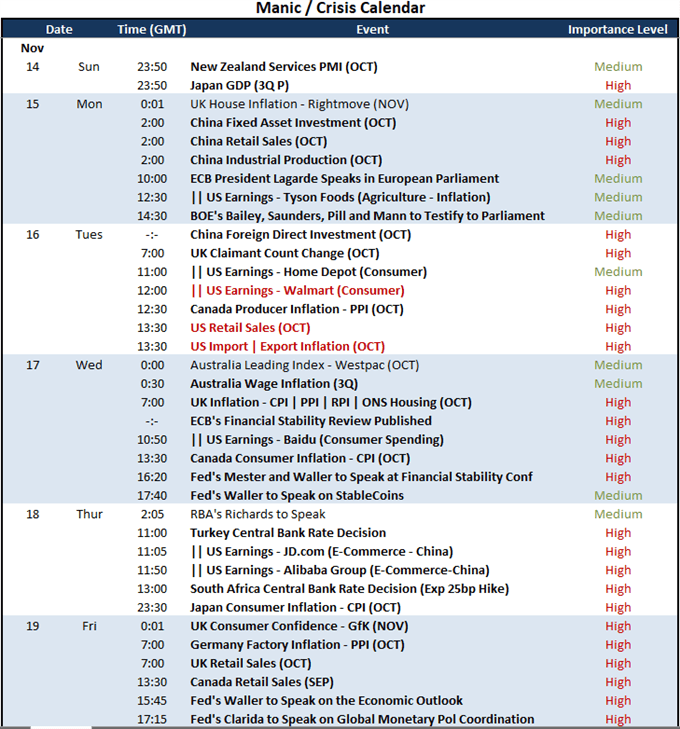
Calendar Created by John Kicklighter
While we are finally finding majors like EURUSD and GBPUSD leading liquid assets with progress, I will keep a vigilant eye out for volatility in possibly thinner markets that have pointed event risk as well. Two exchange rates that are not usually in core watchlists but which I believe should be monitored this week are USDZAR and USDTRY. Both the South African Reserve Bank (influencing the South African Rand) and Central Bank of the Republic of Turkey (influencing the Turkish Lira) are scheduled to announce their policy decisions Thursday. The SARB is expected to hike its benchmark 25bps, but the USDZAR chart has carved out an inverse head-and-shoulders pattern helped by the Dollar’s strength. If they are dovish, it may finally clear 15.50. The situation for the CBRT is the opposite in that they have attempted to cut rates twice despite rampant inflation which has led to an unrelenting drive to record USDTRY highs.
Chart of USDZAR with 100-Week SMA (Weekly)
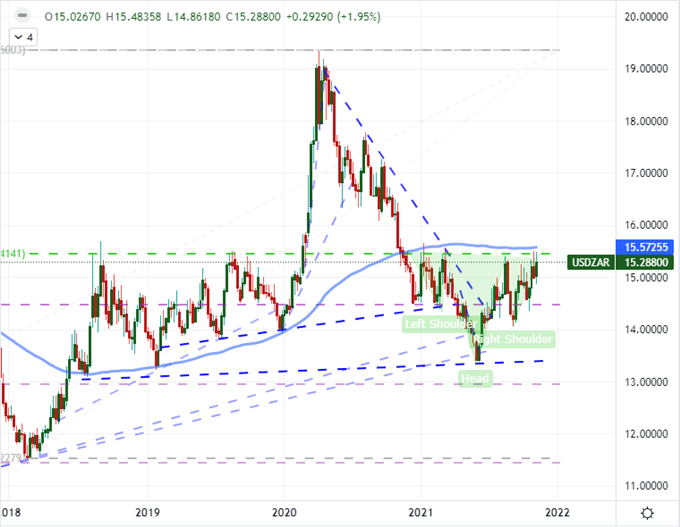
Chart Created on Tradingview Platform


