


S&P 500, Russell 2000, Dollar, EURUSD, GBPUSD and USDJPY Talking Points
- The Dollar’s tentative break Tuesday turned into impressive follow through Wednesday with a push to 12-month highs spilling over to EURUSD, GBPUSD and USDJPY
- Greenback strength is further impressive given the stall in broader risk aversion and the persistent threat around the US debt ceiling
- Despite the overlapping risks around China’s Evergrande, a hawkish underlying monetary policy shift and US debt brinkmanship; the S&P 500 has held its 100-SMA floor

Despite Serious Fundamental Threats, The Benchmark for ‘Risk’ Held the Line
We are facing some serious fundamental threats in the broader financial market at the moment. Despite its retreat from the headlines, the Evergrande situation is far from resolved while the Fed commentary continues to support a move towards taper at its next meeting. Meanwhile, the US debt ceiling standoff and risk of default remains a loaded gun. And yet, with this building wave of fundamental trouble, my preferred baseline of the bullish side of risk trends (the ‘buy the dip’ and ‘diamond hand’ crowds), the S&P 500, managed to hold support through this past session. After a painful -2 percent drop on Tuesday, the benchmark was virtually unmoved on a narrowed range this past session. That was a move that notably held above a confluence of support epitomized by the index’s own 100-day moving average and a consolidation pattern’s (head-and-shoulders) floor. This is far from resolved though from both a technical and catalyst perspective. Don’t take your eyes off your preferred ‘risk’ measure.
Chart of SPY S&P 500 ETF with Volume and 100-Day SMA (Daily)
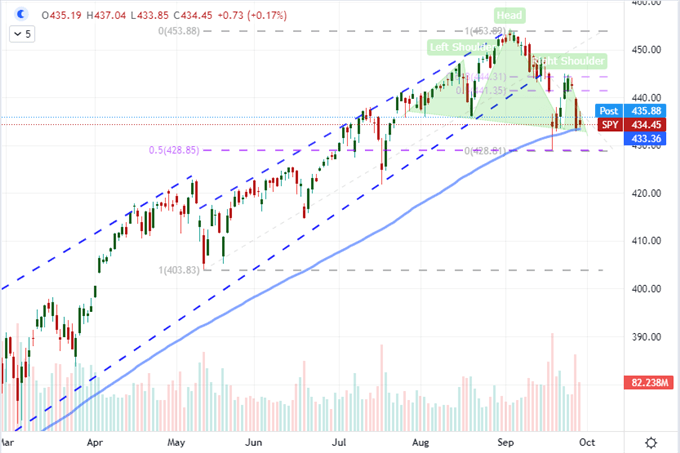
Chart Created on Tradingview Platform
It is worth noting that the coming session is the final trading day for September. This is historically considered the worst month for performance for speculative appetite (using the S&P 500) and the 39th week of the year (which we are currently traversing) is the peak of negative performance. We are already supporting the seasonal expectations on both accounts, but we haven’t fully committed to a bearish course despite these metrics. If we tip into something more systemic, it is likely to mark a more serious pullback in the markets to the point of qualifying as a technical ‘correction’ or even a ‘bear’ where benchmarks retreat 10 or 20 percent respectively from cycle highs. Committing to such a move can bring incredible potential, but it is also a fraught call for a market so used to cutting short reversal and turning them into mere pullbacks. I will keep my judgement to correlation and intensity of the variety of ‘risk’ benchmarks I follow, but the Russell 2000’s position relative to 2,100 can still be an appealing shortcut.
Chart of Russell 2000 with 100 and 200-Week SMAs (Daily)
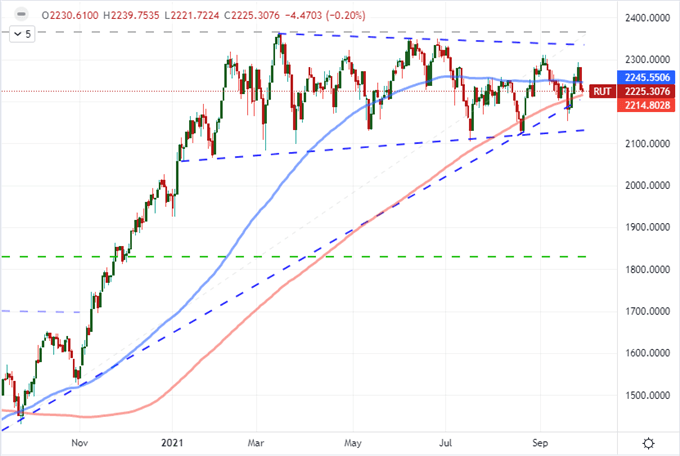
Chart Created on Tradingview Platform
The Major Fundamental Themes are Building Not Transitioning
We have seen a definitive shift in focus in the global financial markets these past weeks, but that doesn’t mean that the graduation of focus is owing to the resolution to the previous threat. In fact, the three major troubles for the global system are arguably building pressure rather than finding relief. However, when the masses perceive a gap of time until the threat is once again pushed to the forefront, a familiar sense of complacency can kick in. As for the state of affairs around the Chinese property developer Evergrande, no solution has been found. There have been stories of the government talking to state-run conglomerates being directed to provide support and the company selling a $1.5 billion in its ownership, but that hardly resolves the threat. Nevertheless, these headlines with a ‘grace period’ after the missed debt payment buy time for the company and markets. It’s pretty aggressive that the Evergrande shares rally 15 percent given the risk, but broader risk assets finding balance is less surprising.
Chart of Major Economies’ Economic Health Via Composite PMIs (Monthly)
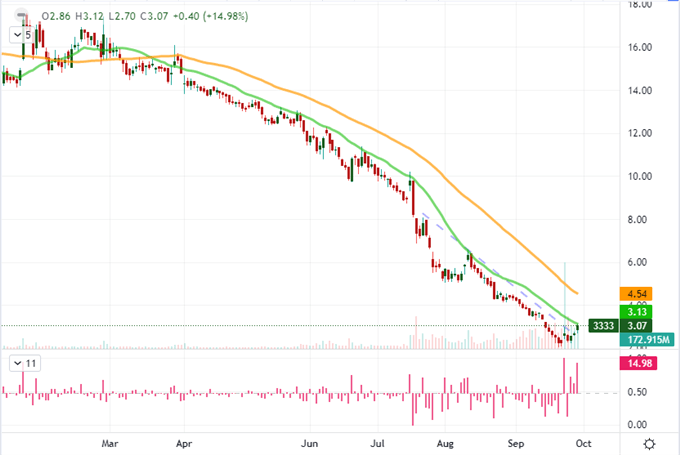
Chart Created on Tradingview Platform
The same general consideration of complacency and moral hazard settling in make sense when it comes to the abstract matter of global monetary policy. The Federal Reserve continued to edge towards a November taper with remarks registered this past session including comments about persistent inflation from Chairman Powell and the appropriateness of withdrawing emergency policy from a dovish SF President Mary Daly. That could have been a boon for the Dollar which charged to 12-month highs on the trade-weighted DXY Dollar Index, but it doesn’t seem to explain the lingering threat of the US deficit ceiling. I would be careful of maintaining an open bullish view of the Greenback as a haven with such a specific fundamental threat emanating from the United States.
Chart of DXY Dollar Index with 100-Day SMA and 4-Day Rate of Change (Daily)
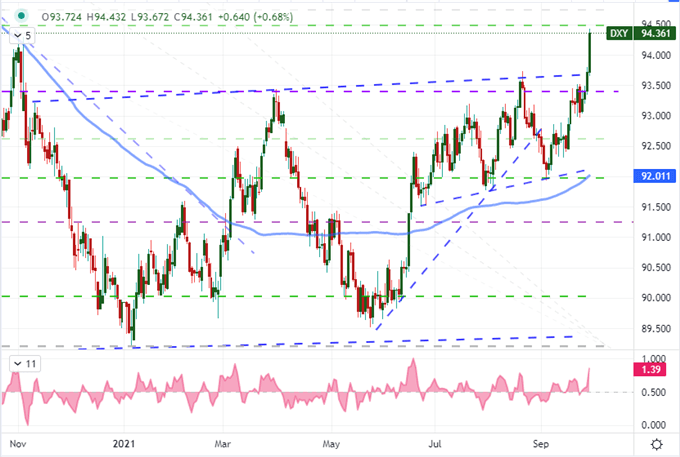
Chart Created on Tradingview Platform
Top Technical and Fundamental Setups for Thursday: EURUSD, GBPUSD and USDJPY
Through this past session, the US Dollar managed to extend a remarkable rally that finally pushed EURUSD into its bearish break. This benchmark cross dropped below the 1.1650 support which was the trough defined by the ‘head’ in an inverse head-and-shoulders pattern. However, the move was even more impressive as there was enough follow through to clear out a wider range band to close at the lowest levels we have seen since September 2020. It is possible that we still hold the general floor of 1.1600 which is both the absolute lows of the past year, the 100-week moving average and midpoint of the past four year range. This is an important indicator as much as a trading vehicle in itself. As the most liquid currency cross – and arguably asset – this is an important measure of the specific US debt crisis threat as safe haven appeal is balanced while monetary policy contrast has been deferred.
| Change in | Longs | Shorts | OI |
| Daily | 0% | -10% | -4% |
| Weekly | -5% | 1% | -3% |
Chart of EURUSD with 100-Day SMA and Consecutive Week Moves (Week)
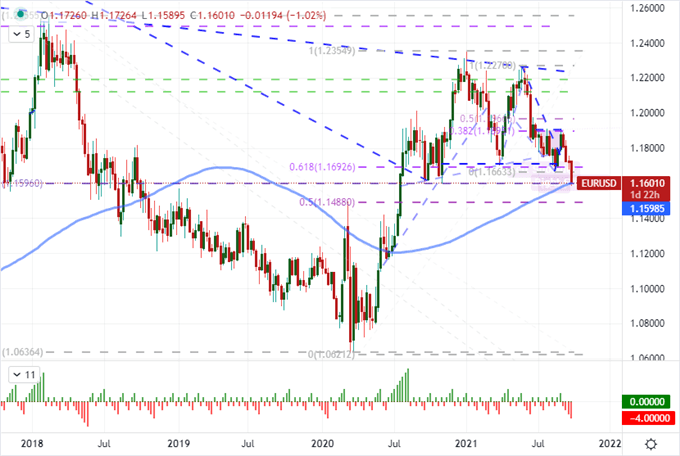
Chart Created on Tradingview Platform
For a more productive technical projection from the Dollar majors, GBPUSD has turned a Tuesday breakdown (at 1.3600) into impressive follow through. I like the overview of this chart with such a well-established congestion pattern through 2021 and a definitive break. If it were just a technical call, this would be my preferred outlet for the majors. However, there isn’t a particularly defined risk exposure or relative monetary policy advantage. In short, as impressive as this development is, it could easily stall out with a counter Dollar move.
| Change in | Longs | Shorts | OI |
| Daily | -3% | -10% | -5% |
| Weekly | 6% | -13% | -1% |
Chart of GBPUSD with 100-Day SMA(Daily)
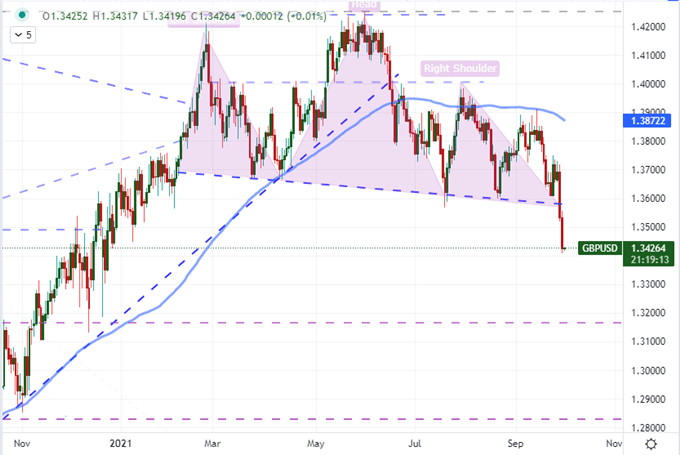
Chart Created on Tradingview Platform
For the most important ‘signal’ from the Dollar pairings, USDJPY remains at the top of my list. This pair represents a drastic monetary policy contrast (BOJ is a multi-decade dove and funder of carry trade) while the relative safe haven appeal between these two currencies is very nuanced. The yen is a ‘moderate’ haven while the Dollar draws more strength from more panicked deleveraging owing to its liquidity. That said, a debt and credit crisis in the US would represent a clear, singular contrast for a pair like this. As such, I will watch as USDJPY attempts to break 112 and a multi-year congestion pattern.
| Change in | Longs | Shorts | OI |
| Daily | -11% | -4% | -5% |
| Weekly | -21% | -4% | -7% |
Chart of USDJPY with 200-Day SMA and 6-Day Rate of Change (Daily)
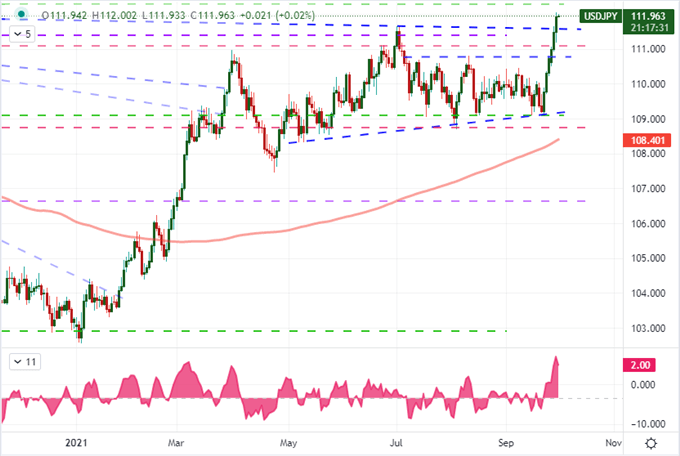
Chart Created on Tradingview Platform


