


S&P 500, Nasdaq 100, USDJPY and Dollar Talking Points
- The S&P 500 ended this past week with a little acceleration to its 5-day slide while the Dow closed below its 100-day SMA for the first time in 215 trading days
- Despite the late-in-the-day risk aversion, markets are still generally anchored and searching for conviction in full risk aversion
- While watching for key breaks from the SPX, USDJPY and Crude; top fundamental potential still rotates around monetary policy ahead of the FOMC decision

A Little Risk Aversion to Whet Our Appetites
The first week of post-Labor Day trade is in the books and it did little to fulfill expectations of a sudden reversal in market tempo from seasonal doldrums to active fall trade. However, there was a spark of volatility into the very close of the week with a general ‘risk off’ during Friday’s New York trading session. The slump was fairly broad, but the technical implications were most notable through the US indices – which hold many traders’ consider bellwethers of sentiment. From the S&P 500, the -0.8 percent slide through Friday was the fifth consecutive bearish session – matching the longest stretch since March 2020 – and a move to bring the post-pandemic channel support into view. It moves us up to the ledge, but we have yet to tip over.
| Change in | Longs | Shorts | OI |
| Daily | -4% | -6% | -5% |
| Weekly | 30% | -25% | -6% |
Chart of S&P 500 with 50-Day SMA and Consecutive Day Moves (Daily)
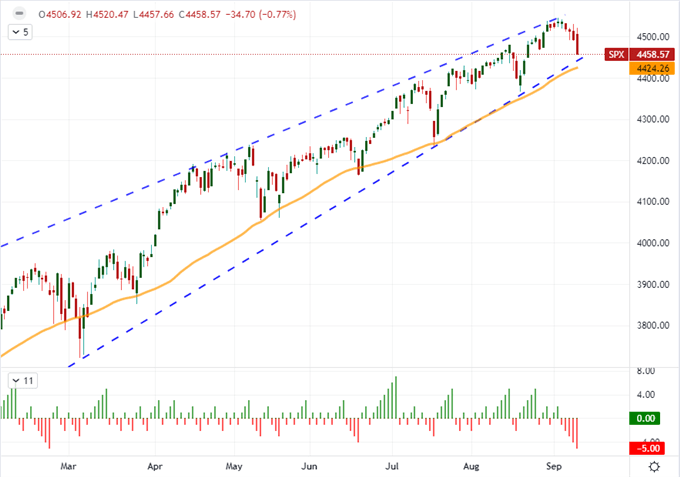
Chart Created on Tradingview Platform
Where the S&P 500 has come upon its own technical support, the Nasdaq 100 managed to break its own immediate floor. A similar percentage loss to the SPX, the tech index dropped through the bottom of its tight range at 15,500. Yet, despite this modest progress from an extremely restrictive range, the historical context of the now-8-day range is still extremely narrow and there are more prominent technical levels to clear below before I would consider it a full blown bearish move. This is a fairly accurate reflection of the circumstance for general sentiment throughout the financial markets: tentative technical moves but full conviction still not at hand.
Chart of Nasdaq 100 with 50-Day SMA with 8-Day Historical Range (Daily)
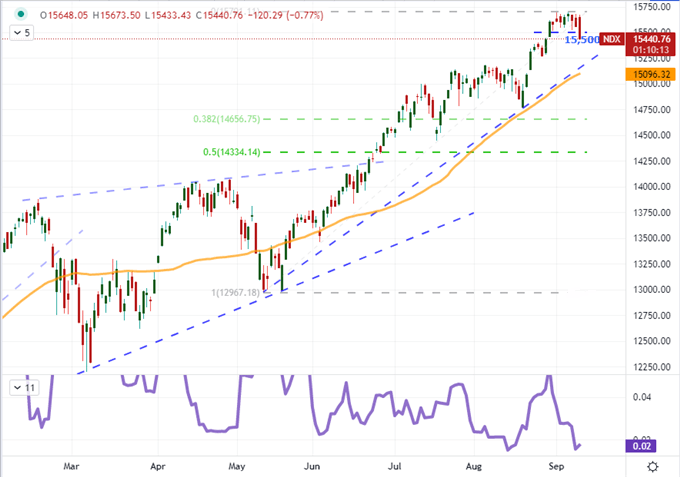
Chart Created on Tradingview Platform
The ‘Real’ Measure of Risk Trend
While I would consider a S&P 500 break of 4,450 an important technical event, it wouldn’t tip my view into the realm of conviction for committed risk aversion. My measure for that systemically-important perspective would be a broad reversal in assets that hold a ‘risk’ connection – both the speculative favorites and the perpetually battered havens. Below, is a range of markets that are fairly different (US stocks, rest of world indices, commodities, emerging markets, commodities and junk bonds); but they tend to align in both direction and tempo when genuine sentiment is in control. Why do I place so much emphasis on ‘risk on / risk off’? While there are many possible catalysts to meaningful markets moves, there are few more universal measures of momentum than fear and greed.
Chart of Different ‘Risk Asset’ Benchmarks Performance Over 12 Months (Daily)
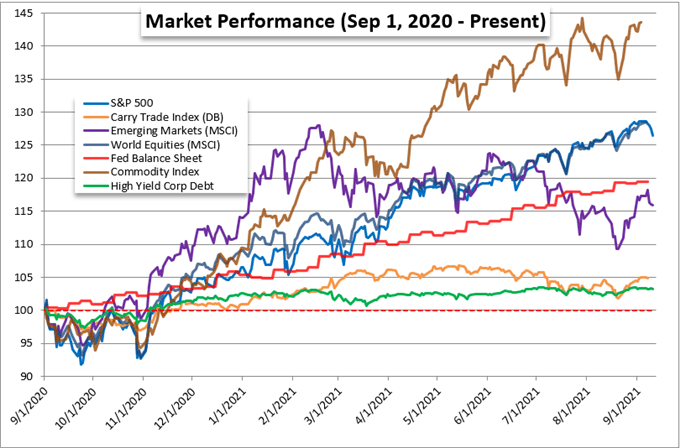
Chart Created by John Kicklighter with Data from Bloomberg
Taking Stock of Quiet and What Is Likely to Occur When Activity Picks Up
Just how quiet are market conditions. I have referenced the slump that the VIX continues to trudge through, the extremely narrow ranges that for indices that have put a fine point on restrictions and the drained liquidity that has thinned out the markets. Let me add another measure to this mix. Below is the number of instances over a three-month rolling period in which the S&P 500 has registered a -1.0 percent or bigger single day loss. In the past 3 months, we have recorded only three such instances. That is evidence of both the bullish bearing and the extremely quiet nature of the markets.
Chart of S&P 500 with Number of -1% Day Losses in Rolling Three Months (Daily)
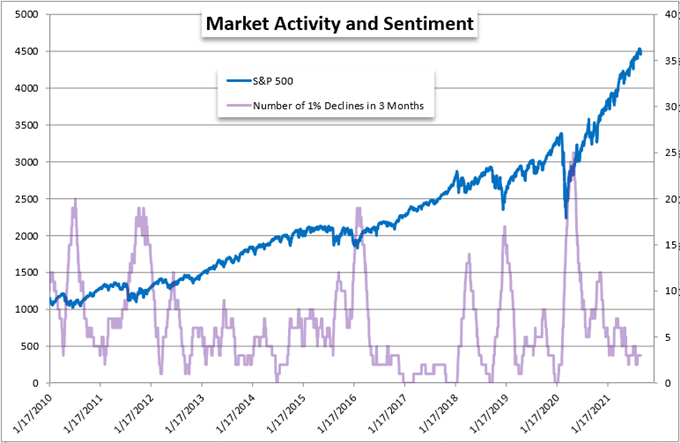
Chart Created by John Kicklighter with Data from Bloomberg
There is a strong relationship between the activity level in the markets and the bearing for which that sentiment manifests. The negative correlation between the S&P 500 and VIX is very strong over the long term. That shouldn’t be too much of a surprise given that the volatility indicator is derived from the options on the index, and those products are historically considered a hedge to the underlying. However, as we have seen in extreme representation this year with the rise of Wall Street Bets and Robinhood, options are more than just a hedge. Another important relationship can be drawn between volatility and the volume behind the SPX. What this suggests is that activity levels are not likely to pick up until the markets start to drop in earnest. So, either we are due a crawl higher or a full-tilt plunge. There of course is middle ground, but big trends are likely to abide by these two speeds…and directions.
Chart of S&P 500 Volume Overlaid with VIX (Weekly)
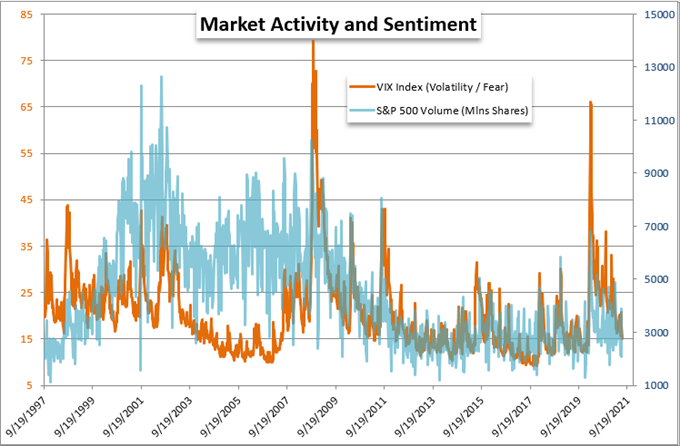
Chart Created by John Kicklighter with Data from Bloomberg
What To Watch This Week: Technical Breaks and a Common Fundamental Theme
As we look ahead to the new trading week, there are technical and fundamental sparks which we should monitor. On the technical side, I’m monitoring the more immediate chart-based barriers for various benchmark markets. The S&P 500’s trend channel support at 4,450 is one such milestone, but there are other measures to watch. Crude oil has found itself bound to a range between 70.50 and 67.50, but it is still not nearly as impressive as USDJPY’s now 18-day historical range. We haven’t seen a band of congestion this narrow for the most liquid ‘carry trade pair’ since I have records. Here, like many other areas, we have the possibility of a near-term break that would still potentially be contained by a much longer-term range dating back years.
Chart of USDJPY with 200-Day SMA and 18-Day Historical Range (Daily)
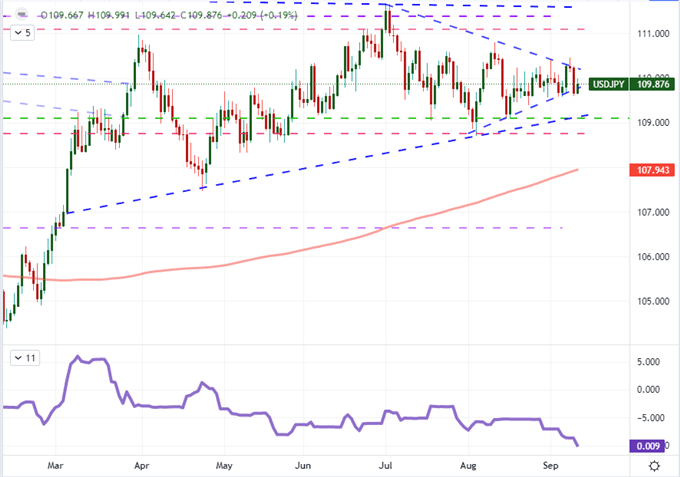
Chart Created on Tradingview Platform
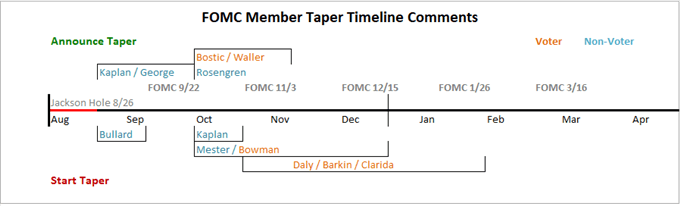
As far as fundamental themes go, there are a number of matters that can potentially draw our attention. The rise of Covid cases in Western economies and the political fight over the US fiscal stimulus and budget (including the risk around the debt ceiling) are practical threats to track. Yet, I believe monetary policy will remain a core concern. This past week, we had rate decisions from the ECB, BOC and RBA – all of which kept the door open to further retreat from extremely easy monetary policy, but all of which put on pause at this particular gathering. In the week beginning September 20th (next week), there will be another run of central bank decisions including the FOMC, BOJ, BOE, SNB and the Norges Bank. In particular, the Fed acts as a compass setting for the global perspective of policy. The US PPI reading hit the highest level in over a decade this past week which bodes poorly for relief on downstream on the CPI due this week. Either way, it stands as a market-moving potential event.
Timeline of Possible Fed Taper with Key Members
Timeline Created by John Kicklighter
Considering the symbolic and practical position of US fundamentals as a guideline for the broader financial system, the Dollar will be just as prominent a litmus test for my analysis as the US indices. The greenback is in its own range on a trade-weighted basis; but many of the major crosses reflect the same – EURUSD, USDJPY and GBPUSD. Should the Dollar commit to a serious bearing, a broader market commitment is likely to soon follow, if it isn’t preceding the currency move.
Chart of DXY Dollar Index with 100-Period SMA (Daily)
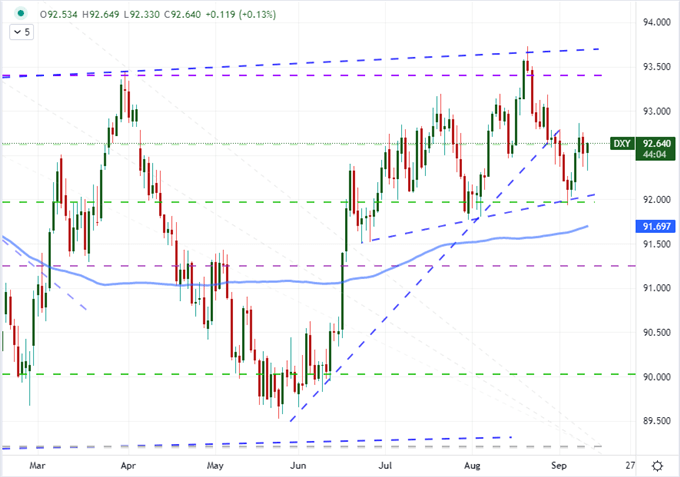
Chart Created on Tradingview Platform


