


S&P 500, VIX, ISM, EURUSD, USDINR and USDTRY Talking Points
- August closed with a tame Tuesday session, but the S&P 500 nevertheless notched a 7th consecutive month’s gain – each establishing a new record high
- September is historically considered a turning point for volatility and volume, but we are still in the throes of holiday trade combined with anticipation for major event risk
- For Wednesday’s session, the Dollar’s stalled breakdown will receive another push from ISM manufacturing while EM currencies hold the most potential

The S&P 500: A Tepid Day and An Exceptional Month
We have brought a close to the month of August with this past session and the closure was met with a fairly mundane daily performance from the benchmarks headed by the S&P 500. Yet, Tuesday’s session didn’t detract from the overall charge for the month. Perspective can significantly alter your assessment of how the markets are performing and what your expectations are moving forward. For the longer-term, buy-and-hold investor; these may seem ideal conditions of deflating volatility that has cut off corrections to very truncated interludes on an otherwise progressive but slow bullish trend. To the more active trader, this has likely been a frustrating period. Those disparate observations are likely to persist as we wade through pre-holiday trade and the expectations of major event risk acting to drag efforts to charge volatility between now and NFPs on Friday. Don’t write off volatility, but deliberate thoroughly its potential for follow through.
Chart of the SPY S&P 500 ETF with 50 and 100-Day SMAs and Consecutive Candles (Daily)
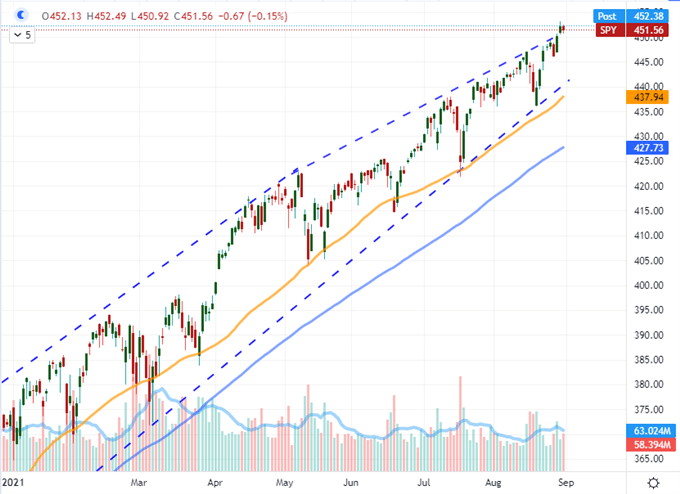
Chart Created on Tradingview Platform
Taking a moment to appreciate the longer-term charts, we rounded out some very interesting monthly pictures. Gold for example put in for a broad but graduated reversal from a failed breakdown throughout August which would ultimately leave a large doji and the third larger ‘lower wick’ for the commodity on record. USDCNH was interesting for very different reasons as the 1 percent range (as a percentage of spot) for August was extremely quiet given the fears over growth and ongoing trade pressures between the US and China. For that reason, it likely reflects regulatory control. For sheer relentlessness, the S&P 500 again takes the top prize with the 7-month consecutive advance. That doesn’t break the record of pacing on this time frame, but it speaks to the bullish backdrop since the Great Financial Crisis ended (or you could argue 2011) and all under the auspices of fading volume.
Chart of SPY S&P 500 ETF with 50 and 100-Month SMAs, Volume and Consecutive Candles (Monthly)
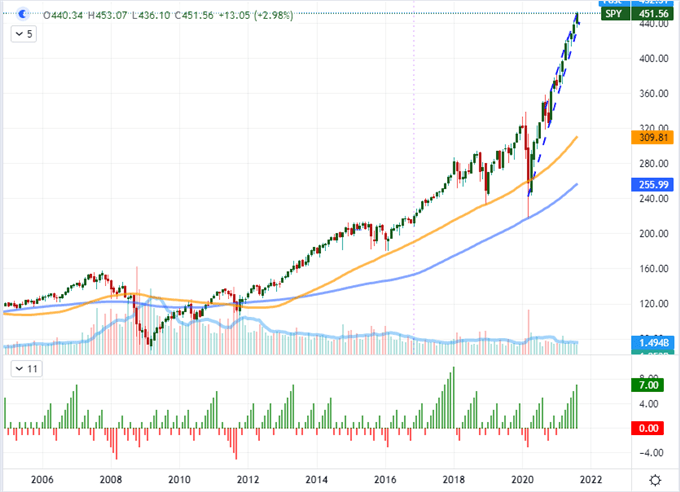
Chart Created on Tradingview Platform
Sort Your Seasonal Expectations
For the uninitiated, it may seem that relief is already upon us. Going purely by historical calendar month segmentation of performance and activity, September is known for being a significant about face in both measures for risk assets like the US indices. However, that doesn’t have to happen on day one. A little further granularity readily reminds us of the US Labor Day holiday which is often treated as the turning point from the Summer Doldrums. That extended holiday is still ahead (Monday), and the week before the liquidity drain certainly sees a materially lower volume than surrounding 20-week averages and generally compared to the week that follows. Performance-wide, the outcome can vary from year-to-year but on average, the SPX averages gains through the week.
Chart of S&P 500’s Performance, Volume and Volatility via VIX Per Calendar Month
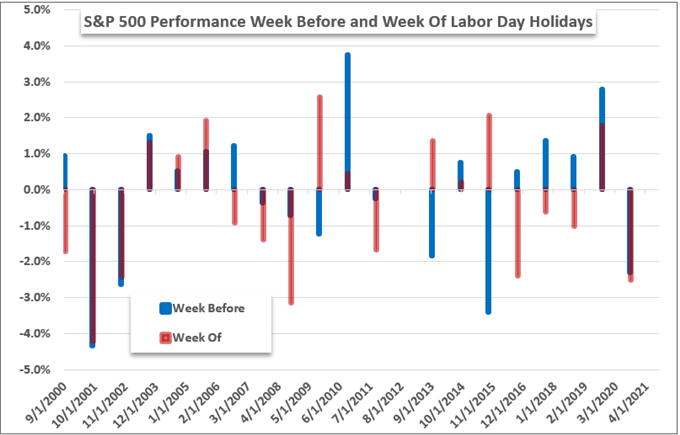
Chart Created by John Kicklighter with Data from Bloomberg
Bigger picture, September is indeed a loaded month in the calendar year. Back to 1980, this is the only month to average a loss for the major US index. Volume tends to pick up marginally on average from August’s dearth, but volatility tends to increase drastically. If we go by the seasons, there are likely more active trading conditions ahead; but remember that these are averages. I personally believe these markets are remarkably stretched and confidence has been built as much on moral hazard and complacency as it has genuine growth. However, the market’s participants can be perfectly fine with that mix for longer than I think reasonable.
Chart of S&P 500’s Performance, Volume and Volatility via VIX Per Calendar Month
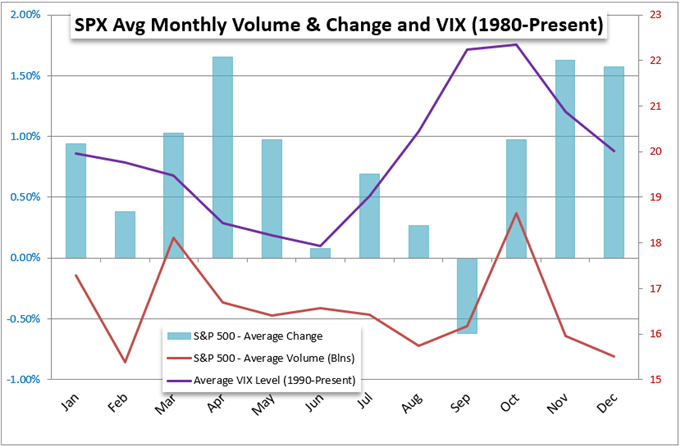
Chart Created by John Kicklighter with Data from Bloomberg
The Dollar and Sparks that Follow a Fundamental Pattern
With the market’s generally falling short on trends but more than willing to lean into short-term volatility, the failed effort to catalyze the Dollar’s technical breakdown intraday this past session was perhaps a little surprising. While follow through is not the standard across the market, this would have been a ‘path of least resistance’ move as it pushes back into a broader range. The top data release this past session was in a good position to urge bears along as the Conference Board’s Consumer Confidence survey was significantly short of forecasts of 124.0 with a 113.8 print. That said, the miss and low (only a six month) wasn’t nearly as severe as the University of Michigan report for the same period released previously. Perhaps the market was already acclimatized. That said, a softening consumer confidence adds to the debate over whether the Fed can taper sooner rather than later. The same potential clout rests with the ISM’s manufacturing report due later today. While services (due Friday) accounts for much more of the economy’s total output, it is nevertheless an important insight in the resurgence in covid cases.
Chart of S&P 500 Overlaid with ISM’s Manufacturing and Service Sector Activity Readings (Monthly)
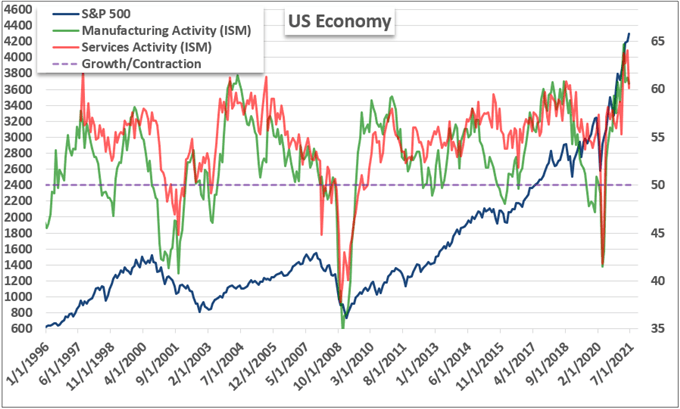
Chart Created by John Kicklighter with Data from ISM
Taking a look at the Dollar’s stunted technical potential, we need look no further than EURUSD. Having already cleared wedge resistance which could open up the broader range of the past year between 1.2250 and 1.1700, the benchmark pair failed to keep its head above the 50-day moving average which had broken in early Tuesday trade. A similar technical impotency was seen from AUDUSD failing to gain traction above 0.7300. Eurozone CPI and Chinese PMIs was a disruption Tuesday, while Aussie 2Q GDP and Eurozone unemployment is likely creating problems for trend intentions today. Always mind the mix of technicals, fundamentals and market conditions.
Chart of EURUSD with 50-Day SMA and ‘Wicks’ (Daily)
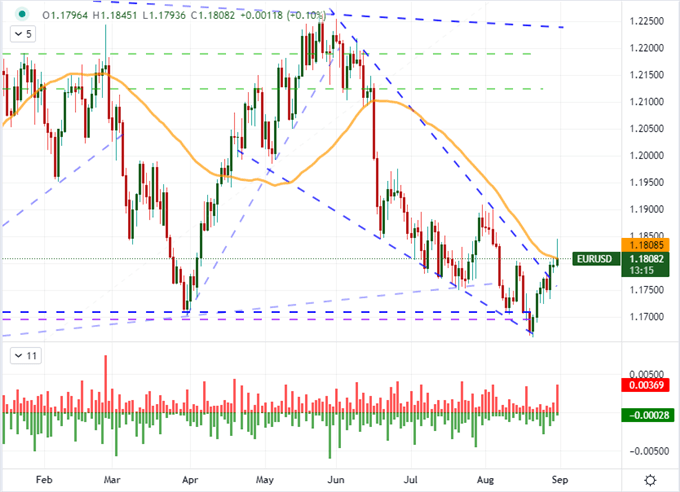
Chart Created on Tradingview Platform
The Emerging Markets and Volatility
Most FX traders rarely stray beyond the ‘majors’ and major crosses, but there is still considerable liquidity – and certainly more volatility – through some of the larger emerging market pairs. Take for instance, USDIND (US Dollar – Indian Rupee) which tumbled through this past session. In fact, the three-day collapse on a break of 74.00 was the biggest dive over that period since March 2020 – the height of the financial crisis and risk fallout that amplified EM volatility. Adding to this move this past session was the Indian 2Q GDP release, a record at 20 percent year-over-year growth but not a full relief from delta variant fears moving forward.
Chart of USDINR with 100, 200-Day SMAs and 3-Day Rate of Change (Daily)
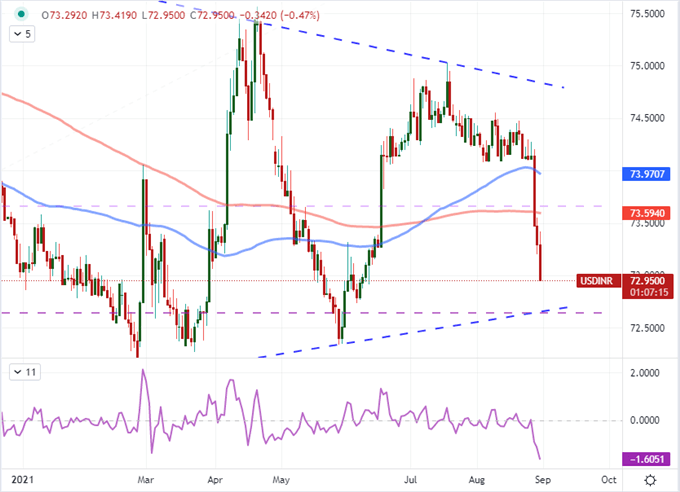
Chart Created on Tradingview Platform
If you take a look at the economic calendar, you’ll find a significant run of major emerging market event risk that can trigger significant volatility. There are manufacturing PMIs due from China (Caixin), South Korea, India, Russia, Brazil and Mexico ahead. Further, there are 2Q GDP reports due from both Brazil and Turkey. All of this will give important insight into local assets and currencies as well as a course adjustment for the overall picture of global growth (of which emergent markets play a significant role). However, for sheer technical appeal, I have to go with the USDTRY chart. There is a fairly overt range support around 8.3000 and it would be difficult to miss the corollaries to USDINR. Then again, Turkey wants to significantly reduce the country’s benchmark lending rates, when inflation allows…
Chart of USDTRY with 50 and 200-Day SMAs (Daily)
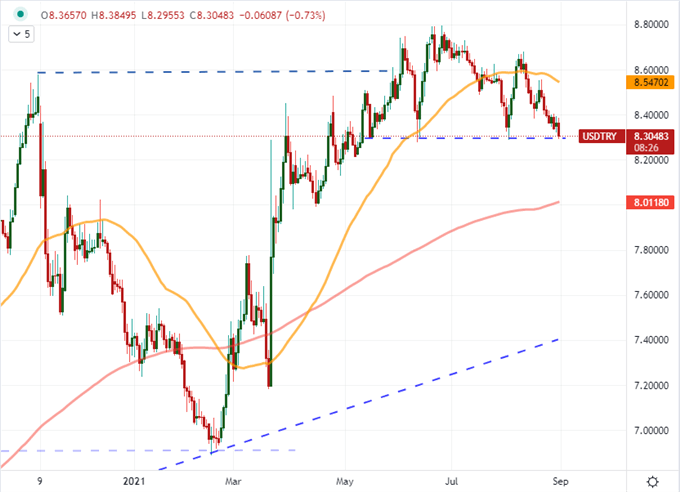
Chart Created on Tradingview Platform


