


Amazon, FAANG, Dollar, USDCAD and EURUSD Talking Points
- Despite the exceptional docket this past week, risk trend benchmarks like the S&P 500 and FANG (sans Amazon’s volatility) members ended without a definitive trend
- We are heading into the month of August which is historically the nadir of volume and liquidity of the year for the benchmark S&P 500
- Though there are highlights like July NFPs, US ISM service sector activity and the BOE rate decision; there is little with an overwhelming fundamental influence

Market Reversal Risk Raised by FAANG Slump but Conditions Thin Out Ahead
We have closed out the week and month of July with a notable slide in some key measures of risk trends. In particular, the FAANG stocks – the symbolic leader of speculative momentum these past few years – have collective dropped to a month low and Amazon specifically suffered a 7.6 percent collapse on Friday alone. The highest peaks tend to topple first. However, the downdraft from core measures like the S&P 500 and Nasdaq 100 hardly raise anticipation for a full-blown bearish sweep. Pressure continues to build amid indecision as the likes of the Dow Jones Industrial Average has carved out its smallest weekly (5-day rolling) range since the cycle of extreme quiet through the end of 2017. Looking out of the week ahead, the possibility of a relief break is certainly in the cards, but a move of conviction will struggle given the backdrop for liquidity. Furthermore, the docket will provide limited scope for charging volatility. While there are a few highlights like the Friday US NFPs and Bank of England rate decision, these events hold limited capacity to upend global markets.
Chart of the Amazon Stock Price with 100-Day SMA Overlaid with FAANG Index (Daily)
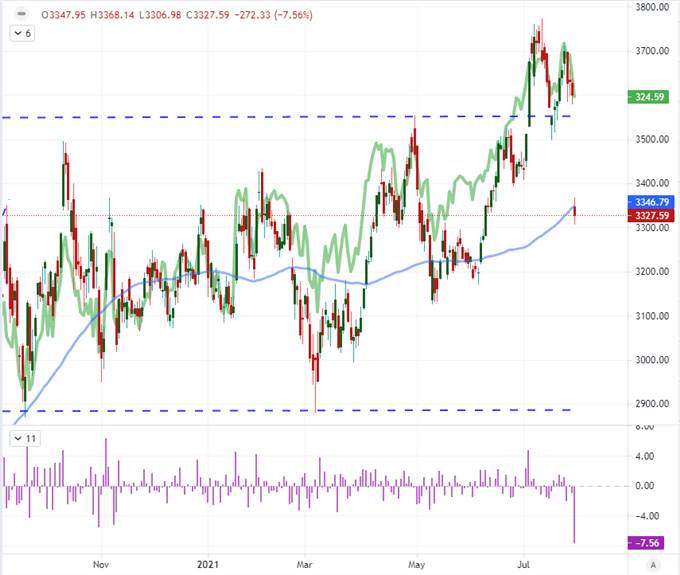
Chart Created on Tradingview Platform
While I like to keep close tabs on the scheduled event risk to assess whether there are volatility landmines ahead, it is also important to scope the broader landscape to evaluate general ‘market conditions’. Many like to group conditions like market depth, trend frequency, cross market correlation and volatility into technical or fundamental analysis grouping. I believe that these elements deserve their own category and that their collective influence should be considered first before the other techniques. Taking stock of this backdrop, the concerted activity levels across the different asset classes have certainly waned and a resistance to high-profile event risk seems to be working against productive market movement. To add to these present conditions, we have the pull of historical seasonality. Using the SPX as the benchmark, the month of August represents the most reserved trading month in volume terms (trading-day adjusted) even as volatility rises as a by-productive of depth. While I’m already skeptical of systemic moves at present, these added assumptions will only deepen my reservation.
Chart of S&P 500 Seasonal Performance, Volume and VIX
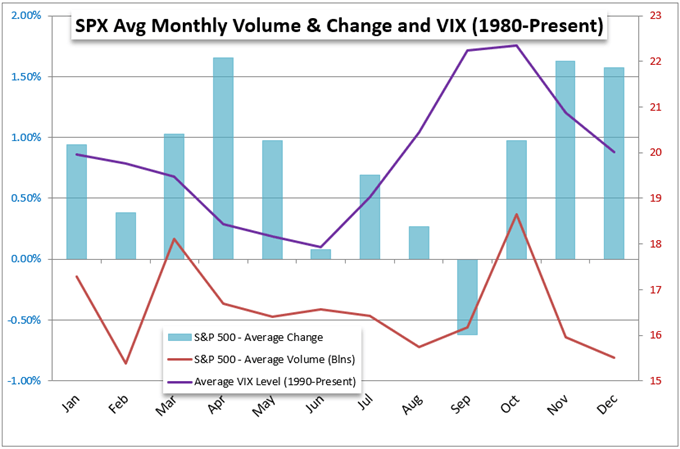
Chart Created on Tradingview Platform
Monetary Policy is Still a Top Lurking Fundamental Theme Ahead
When looking for disruption from the immovable restraint blanketing these markets, it is best to identify the particularly effective fundamental themes that can break the inertia. Monetary policy was this past week’s dominant theme – even though it couldn’t resolve a trend – and will likely be a key force ahead. While the Fed took pains to reassure the markets of its slow pace moving forward, the market picked up on the hawkish learn over the longer term. That was the state of mind the market was in when the central bank’s favorite inflation figure crossed the wires Friday. While core PCE was pacing slower than was expected, the 3.5 percent clip was still the fastest since 1991 and far above the Fed’s target. Monitor for other disruptors of interest rate forecasting going forward – as much for the globe as for the US.
Chart of US Consumer Inflation PCE (Monthly)
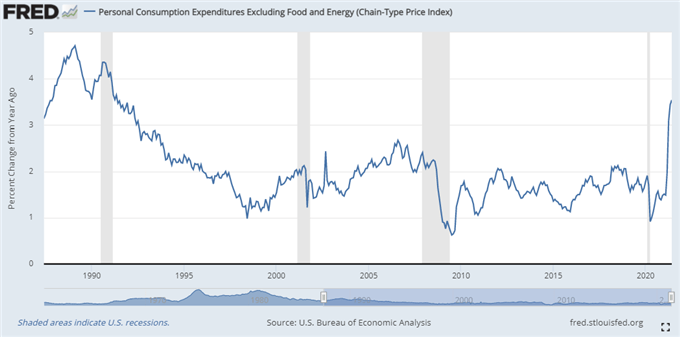
Chart Federal Reserve Economic Database with data from BEA
Speaking of the Dollar, we ended this past week in an unusual position. Following the Fed’s slow walk into a taper on Wednesday, the robust US GDP on Thursday and 30-year high in inflation on Friday; it was not particularly surprising to see the Greenback take a jog higher. The break of the four-day slide curbs the range swing but it may not sustainably upend the congestion tracking. If the bounce for USD was founded on rate expectations, why did the US 10-year Treasury yield slip while implied yields from the Fed Funds futures cut the probability of a full 25 bps rate hike by the end of next year to 50 percent? The Dollar deserve closer attention in the week ahead as well with key manufacturing and service sector activity, local earnings and of course the NFPs. All can weigh in on monetary policy speculation, but it is more imminently charge the US currency to action.
Chart of DXY Dollar Index Overlaid with Consecutive Candles and Fed Implied Hikes Dec 2022 (Daily)
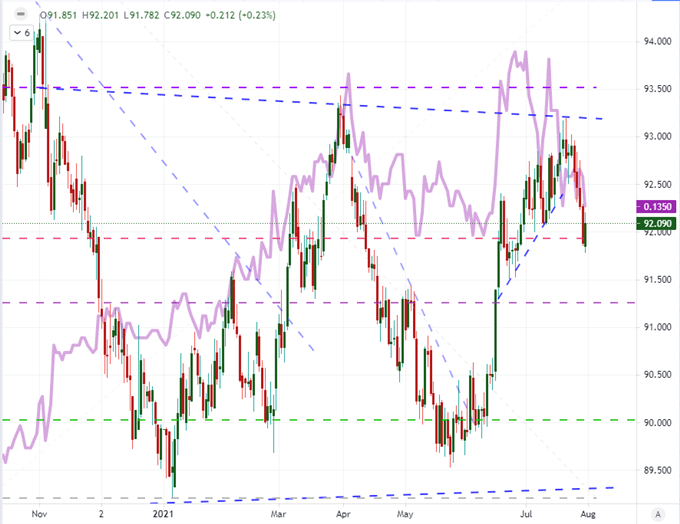
Chart Created on Tradingview Platform
Dollar Pairs Top My Watch List and the Window for Monthly Charts is Open
For potential in the week ahead, I will digest all of the seasonal aspects, evaluate fundamental blast radius of key events and keep tabs on assets with key technical boundaries at hand. All of those elements considered, I believe the Greenback to be on of the more potent baselines. The Dollar broke lower this past week with more than a few technical triggers of note. It is tempting to look upon these developments as more productive than other areas of the market, but the same rules apply. Follow through is difficult to muster. For USDCAD, the break below the 20-day moving average was a milestone, but it doesn’t push us back to the 1.20000 floor registered on the higher timeframe chart. Nevertheless, the ‘upper wick’ generated from the July candle is of remarkable scale in historical standards.
Chart of USDCAD with 20-Month SMA, Wicks and COT Net Spec Futures Positioning (Monthly)
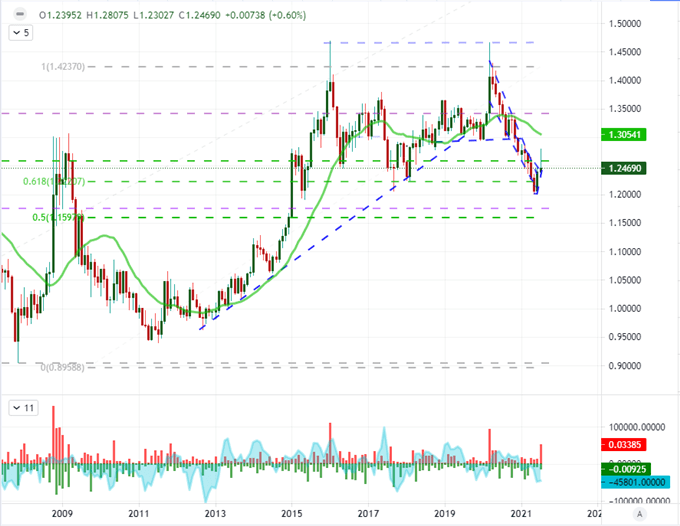
Chart Created on Tradingview Platform
Top event risk ahead includes emerging market PMIs and central bank decisions (Brazil and India), US and Canadian employment reports and the ISM US activity reports for July. Yet, there is perhaps greater potency in targeted volatility from the likes of the Australian Dollar and British Pound with an RBA and BOE rate decision on tap respectively. It is a push and pull as to whether docket listings can override the reticence of the markets, but discretion is the better part of valor. For a better mix of productive qualities, I will raise EURUSD up. This pair has moved back into range this past week and there is limited event risk to turn action into anticipation. What market or pair are you most intent upon?
Chart of the EURUSD with 20-Day SMA and 20-Day Historical Range (Daily)
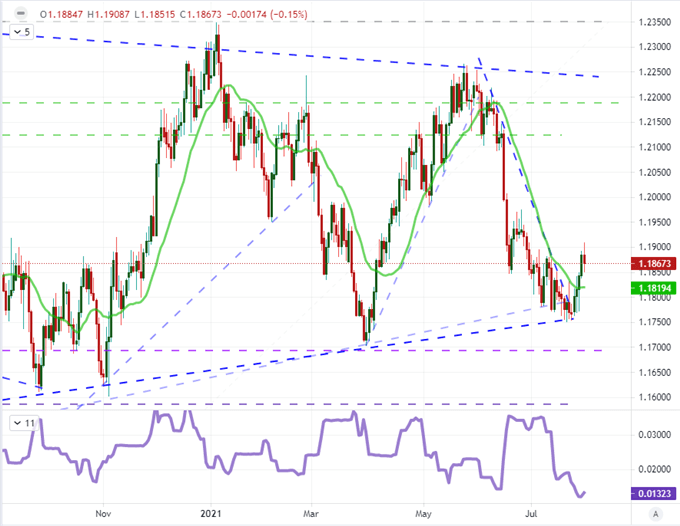
Chart Created on Tradingview Platform


