


Dollar, Nasdaq, Dow Jones, EURUSD and GBPUSD Talking Points:
- In the wake of the FOMC rate decision whereby the central bank’s members have moved forward rate hikes, the Dollar extended its bullish breakout
- EURUSD continues to traverse its broad range while USDCAD has returned to the upper bound of its descending trend channel, GBPUSD and AUDUSD are attempting the ambitious
- Risk assets generally leveled out post-rate decision, but an acute divergence between the Nasdaq 100 and Dow indicates how reliable the rebound is likely to be
The Influence of the Fed After Its Decrees Have Been Absorbed
With the Federal Reserve’s measured monetary policy shift behind us, we can see more clearly what level of impact the central bank has exacted on the markets. The Dollar’s enthusiasm is proving more productive in the aftermath of the hawkish shift than the risk aversion that we find on benchmarks like the US indices. That is perhaps not particularly surprising given the scope of the central bank’s actions and signaling, but it does speak to the influence from broader market conditions which have anchored the financial system through the confluence of seasonal and structural liquidity conditions. For traders, the appetite for trends can often override a rational evaluation of market conditions. Volume and liquidity are still critically deflated despite this week’s top event risk, but that doesn’t mean there are no options to pursue across the global markets. I will note that the DXY Dollar Index’s two-day rally through Thursday was the biggest move since the peak of the pandemic rally back in March of 2020. Nothing comparable to this tempo is evidence since the 2016 election in November. That isn’t a statement to a gravity-defying trend development, but it does deserve a closer observation.
Chart of DXY Dollar Index with 20 and 50-DMAs, 2-Day Rate of Change (Daily)
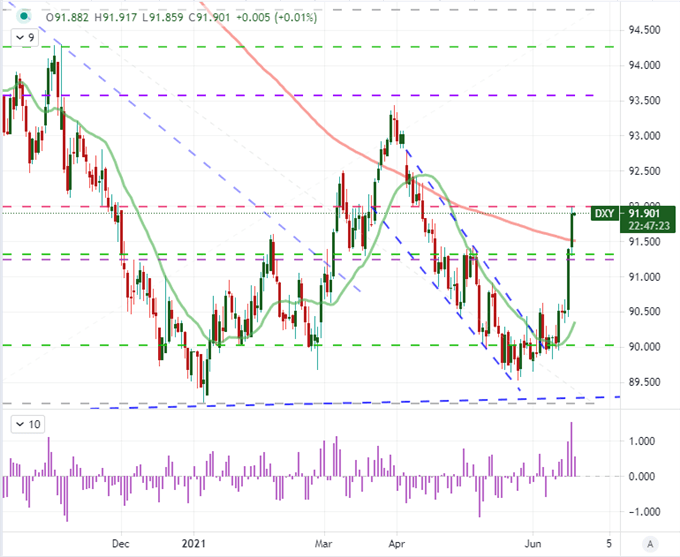
Chart Created on Tradingview Platform
In contrast to the Dollar’s extended advance, risk aversion in the aftermath the Fed’s upgraded forecast for monetary policy (shifting forward rate forecasts to predictions of 50 bps worth of hikes in 2023) seems to be rather nonplused. To be sure, the world’s most influential central bank signaling its intentions to start reversing its record accommodative policy stance in the coming two years is a practical concern for those evaluating ‘value’ or the cost of leverage. Yet, for the short-term trader, a shift in policy beyond the immediate horizon is not the imminent threat that would override the average investors’ deference to seasonal liquidity conditions. That said, I will point out that there is at present a very distinct skew in confidence to support speculative momentum rather than core ‘risk’ assets. The Nasdaq 100 pushed to a record high this past session while the Dow extended its slide into a possible critical technical breakdown. We haven’t seen these two benchmarks on this divergent a path (10-day correlation) since June 2017.

Chart of the Dow Jones Industrial Average Overlaid with 20 and 50-DMA and SKEW (Daily)
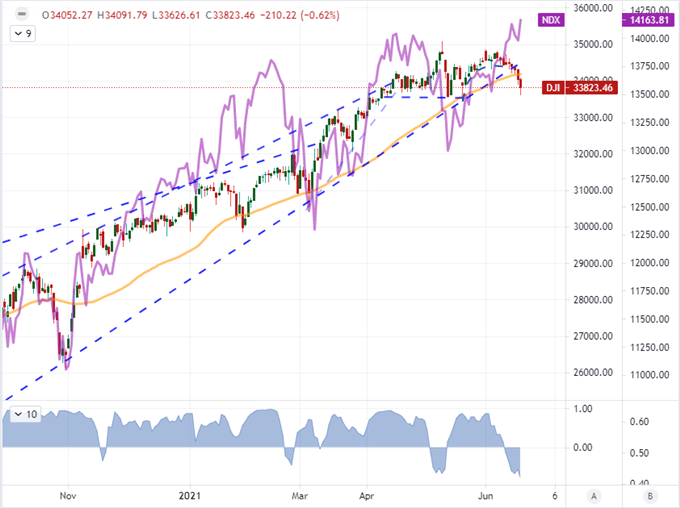
Chart Created on Tradingview Platform
How Monetary Policy Registers for the Market
Between the Dollar’s rally and US equites’ mixed performance, it is obvious that there isn’t an overwhelming response to this week’s top event risk. Why are capital markets not more unnerved by the Fed’s decision to warm investors to the reality that its path is starting to shift towards a slow withdrawal of its exceptional support matrix? Time. While the FOMC seems to be running up a warning flag to the financial system that it has found its peak exogenous support, it is arguably an 18 month journey until we see the first rate hike and at least a few months until we see an actually reduction in the monthly purchase of assets in which the central bank engages. Speculative interests are looking to exploit short-term opportunities rather than invest in the long-term – a consideration that displays clearly in the Nasdaq 100 to Dow divergence.
Chart of the S&P 500 Overlaid with Major Central Banks’ Balance Sheets in $Bln (Monthly)
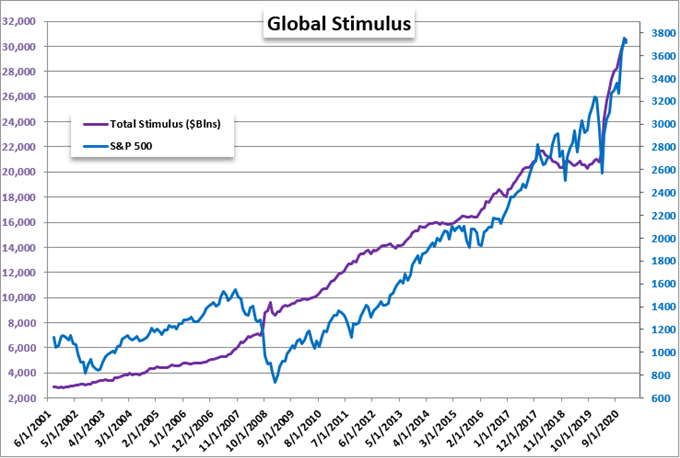
Chart Created by John Kicklighter with Data from FRED
In contrast to the slow turn in global monetary policy urged by the Fed’s measured language, the contrast in relative efforts between the Fed and its peers makes for a more distinct story. Perhaps that is why the Dollar is carving out a more productive path. With the FOMC’s official SEP (summary of economic projections) forecasting two standard 25 basis point rate hikes through 2023, the US authority finds itself in one of the most hawkish positions of the global policy regime. While we may be in an environment where rates are near zero across the board, forward forecasting will carry greater weight among the speculatively-motivated or those looking to avoid negative real rates. In this assessment, the Dollar’s appeal stands out.
Chart of Relative Monetary Policy Standings of Major Central Banks
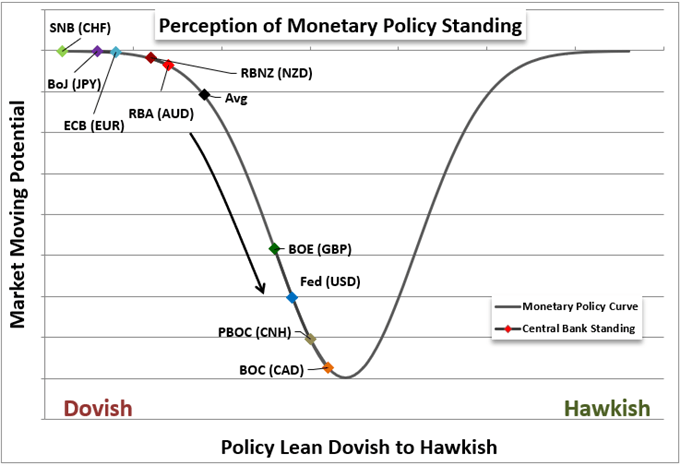
Chart Made by John Kicklighter
The USD-Base Majors: The Practical and the Moonshot
Even though the Greenback holds some of the greatest potential in my view of the broader markets, there are no doubt limitations as to what the currency is able to exact with the financial system struggling for traction. In general, ranges are more appealing on a technical basis as the requirements of conviction are far more modest. USDCAD was one of my favorite pairs heading into the FOMC rate decision, but we have now covered the full span of the longer-term (15-month) descending trend channel with a test of 1.2375. It is possible to clear this upper boundary, but follow through would need something more substantial than just a fundamental coast to keep it running.
| Change in | Longs | Shorts | OI |
| Daily | 8% | -10% | -5% |
| Weekly | 11% | -4% | 1% |
Chart USDCAD with 50 and 100-DMAs and 30-Day Historical Range and ATR (Daily)
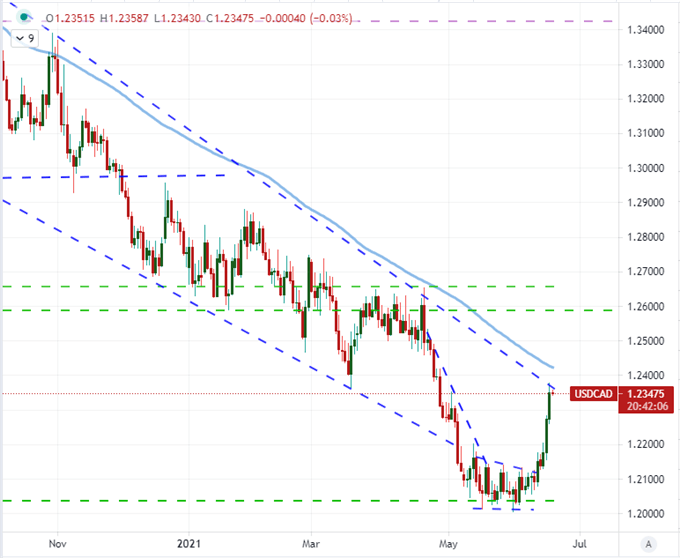
Chart Created on Tradingview Platform
For technical scope, EURUSD has more room to run. That said, the two-day tumble for this benchmark pair is far more impressive overall. The biggest drop in a 48 hour period since the height of the pandemic crisis reflects an extreme bid for the Greenback. That reference was a period that bolstered the currency’s safe haven status, but current conditions seem to favor more of a yield comparison. This isn’t any greater a liquidity override however, so the path isn’t exactly cleared all the way down to 1.1700/1.1600. However, if traders are looking for exact a ‘path of least resistance’ view, this is a cross to monitor.

Chart of EURUSD with 200-Day Moving Average (Daily)
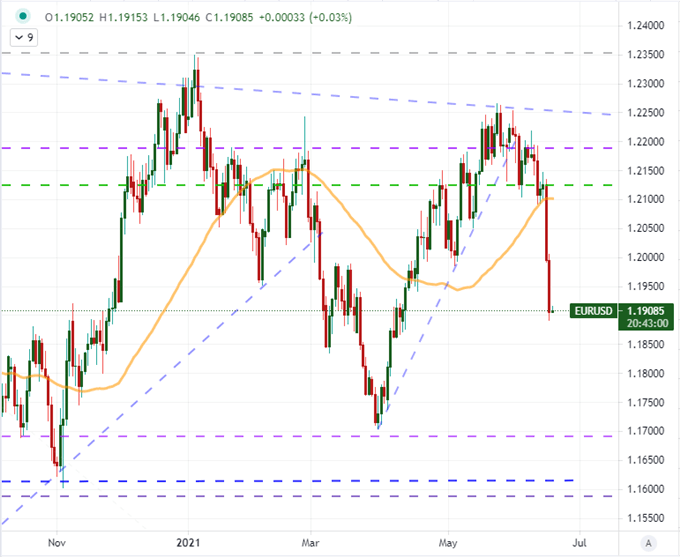
Chart Created on Tradingview Platform
While I believe market conditions are carrying far more weight than recent technical and/or fundamental developments – and thereby potency of trend development is limited – there are certainly more grand chart patterns to take note of across the majors. GBPUSD is one such example having cleared its 50-day moving average and post-pandemic recovery trendline support around 1.4000. The break is certainly clean, but follow through is not exactly clear given the mix we currently have at hand. Perhaps next week’s BOE rate decision will boost the fundamental signal, but that is some ways into the future.

Chart of GBPUSD with 50-Day Moving Average and COT Net Spec Futures Positioning (Daily)
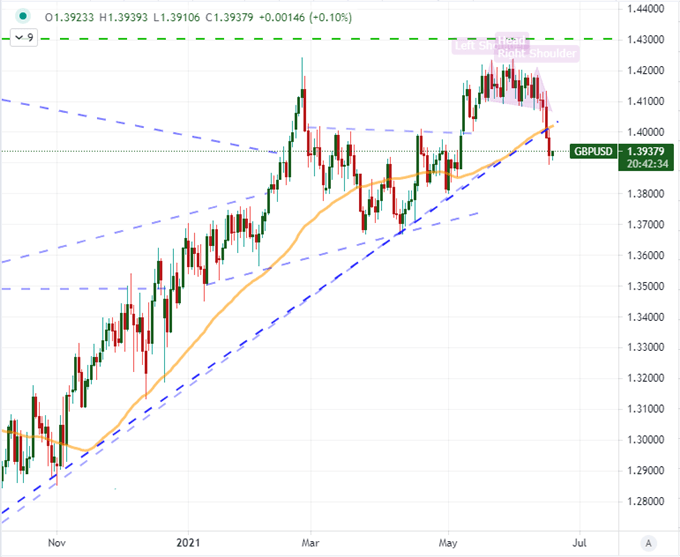
Chart Created on Tradingview Platform
Perhaps an even more dramatic, big-picture technical picture is developed by AUDUSD. With the Dollar’s rally this week, we have seen this pair dive to the floor of a congestion pattern that has developed throughout 2021. In fact, the head-and-shoulders pattern may have earned an official ‘neckline’ breakdown this past session with a close below 0.7575 – though it was notably still wrestling with the 200-day moving average. I have a deep appreciation for technical analysis, so this development is very seductive, but momentum is based on far more than mere technical breaks. If the Dollar finds further reason to rally or risk aversion takes a full-tilt dive, this pair will draw on further motivations to continue lower. Until then, maintain a healthy sense of skepticism.
Chart of the AUDUSD with 200-Day Moving Average (Daily)
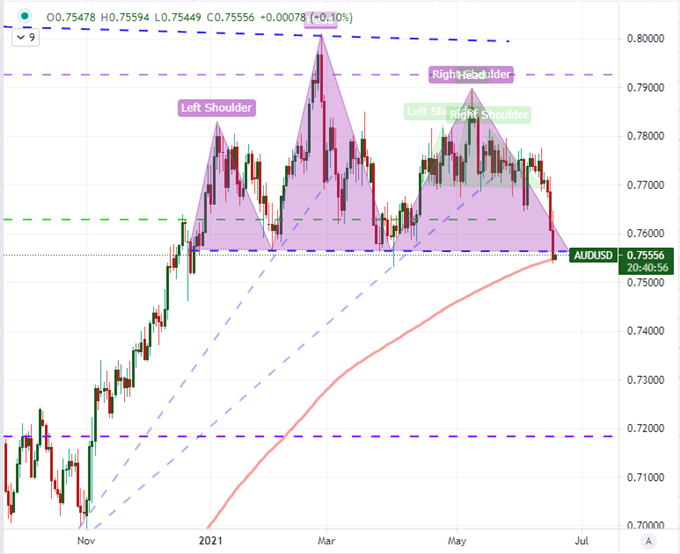
Chart Created on Tradingview Platform

.


