


S&P 500, Dollar, GBPUSD and AUDUSD Talking Points:
- The recovery rally for the S&P 500 and other risk-leaning assets through the end of this past week didn’t carry over to Monday with the market stalling just off records
- Over the weekend, former Fed Chair and current Treasury Secretary Janet Yellen remarked that slightly higher rates would be ‘good’ – but neither Dollar nor yields caught
- Historical ranges for the likes of the S&P 500, Dollar, British Pound and Australian Dollar crosses are extreme restricted; but are there breakouts ahead?
With 0.3 Percent of a Record High and the Most Restrictive Trading Range in Years
Market participants were on high alert to start the new trading week following the late recovery rally from the likes of the US indices to close out this past Friday. The fundamental focal point through that period of closing liquidity was the US labor report for May. Nonfarm payrolls (NFPs) grew by nearly half a million positions through the previous month, but still managed to fall well short of forecasts. That seemed to strike the exact right chord for those monitoring sentiment in capital market channels as it both supported the outlook for strength from the world’s largest economy while also managing to cool some of the concern that the Fed would be pressured into an early course correction on extreme accommodation (near zero rates and hefty asset purchases). While that data wouldn’t suppress sentiment, it also didn’t charge it at record highs. Further, former central bank head and current Treasury Secretary Janet Yellen issued remarks that stirred the pot of worry again. Ultimately, I believe general market conditions between structural and seasonal restraints kept has kept the market in check through the week’s open. Yet, is important to mention that the trading range from the S&P 500 over the past two months is the most restrictive as a percentage of spot since September 2018.

Chart of the S&P 500 with 20 and 100-DMAs, 42-Day Historical Range and ATR (Daily)
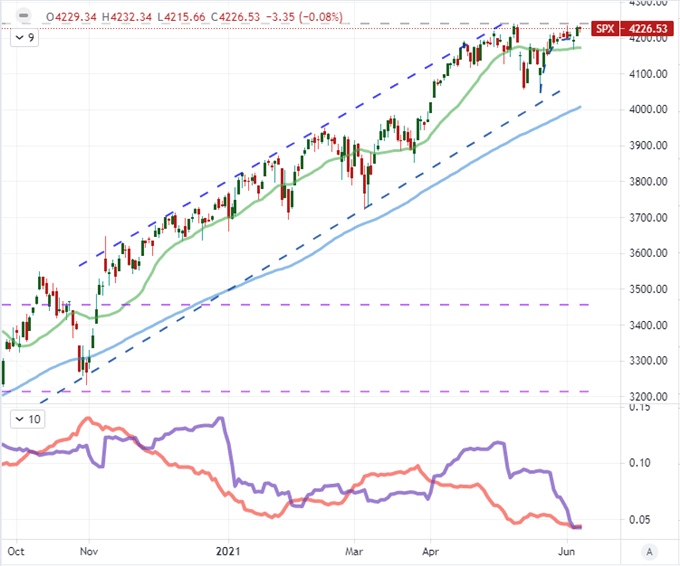
Chart Created on Tradingview Platform
Constricted price action is not reserved for merely the US indices. There is a remarkably conservative price range for a host of assets that align to sentiment and are on the deep end of the liquidity pool. That serves better to dampen the risk of an imminent break when the lethargy is so large, but traders should nevertheless remain tuned in to shifting currents across these many related markets. Historically-speaking, the month of June is the statistic nadir for the VIX volatility index, but I would say that markets are more pressurized than normal so close to price extremes and given the backdrop with which we have to deal. Timing is changes in activity levels and direction are up for heavy debate, so I thought it a good time to ask traders what asset class looked most interesting regardless of direction but taking into account preferred trading styles. Despite the extreme highs in US indices, the volatility of meme stocks and constant references to crypto; interest in Dollar-based ‘majors’ won out.
Twitter Poll Of Most ‘Tradable’ Asset Class for This Week
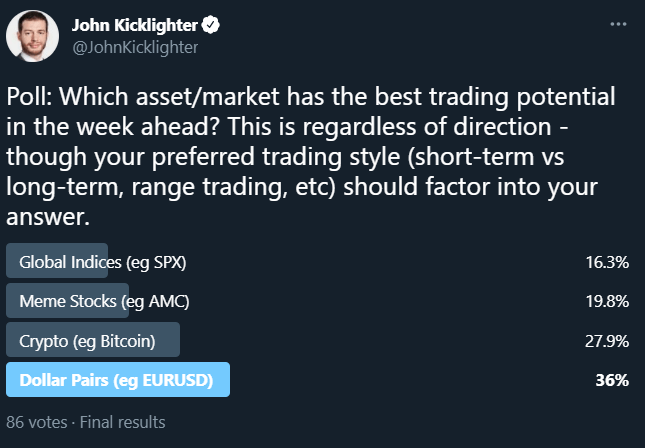
Poll from Twitter.com, @JohnKicklighter
Janet Yellen Speaks for the Fed While They are in a Media Blackout
As of Friday evening the US central bank entered its media black out period. This self-imposed quiet precedes rate decisions (next event is Wednesday, June 16th) so that the group or its members don’t inadvertently generate undo volatility in the financial system. That said, in a world where the market has grown so dependent on extreme amounts of stimulus to the point of moral hazard while also looking for constant reassurance that the infusions will remain in place for the foreseeable future, quiet can undermine. Through last week, rhetoric from some Fed members seemed an effort to acclimatize market participants and Americans to the possibility of taper discussion as the first step to normalizing extreme policy. When Treasury Secretary Janet Yellen said in an interview over the weekend that inflation could continue to rise with fiscal spending and that a slightly higher interest rate could be good for the economy, I believe the remarks were most likely run by Fed Chairman Powell. Even if that were the case, the market didn’t seem to take the comments at face value. While the US 10-Year Treasury yield opened with the biggest bullish gap since November 2016, the market quickly closed the ‘window’. Further, gold which usually struggles on an upgraded rate forecast edged higher.
Chart of US 10-Year Treasury Yield with 20 and 100-DMA, Gaps and Gold Overlaid (Daily)
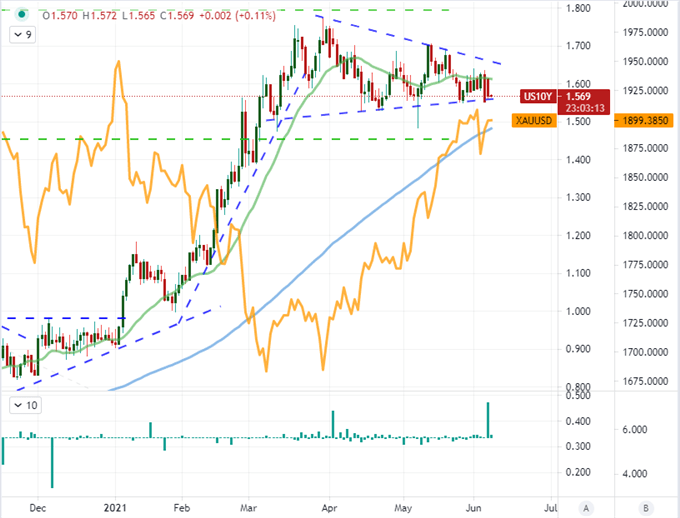
Chart Created on Tradingview Platform
Further, typical benefactors to the an upgraded rate forecast that floundered were the implied yield forecast from Fed Funds futures and the US Dollar itself. The Greenback suffered a sharp hit following this past Friday’s employment report, and the slide continued despite the fundamentals to digest this past session. That said, there remains a technical ambiguity with regard to intent. While we’ve retraced the attempted bullish channel break from last week, there is still the capacity for a former resistance to act as new support largely because we are still trading in a large range. There is considerable capacity for congestion seen here on the trade-weighted index, but the intensity of this struggle is even more on display with various crosses.
Chart of DXY Dollar Index with 20-DMA, Wicks Overlaid Fed Futures Forecast Dec 2022 (Daily)
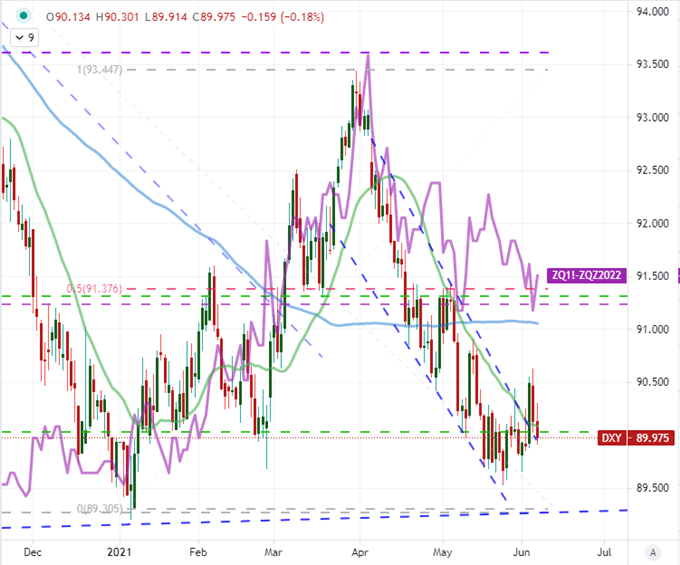
Chart Created on Tradingview Platform
Where the Congestion is Growing Extreme
Looking across the FX spectrum, I can see where retail trader interest is perhaps so fixated. There are extraordinary examples of charts that ride the line between persistent congestion and pressurized breakout candidates. Take for example USDCAD. The past 20-days of trade (equivalent to a month) has seen markets establish a slowly dwindling range that has only one comparable period over the past 16 months while doing so on an extraordinarily high-profile support – the midpoint of the 2011 to present range and series of serious lows back to 2015. In turn, the net speculative futures positioning from the COT reflect a heavy lean into the bearish view.
Chart of USDCAD with 20 and 100-DMA with Net Spec Futures Positioning (Daily)
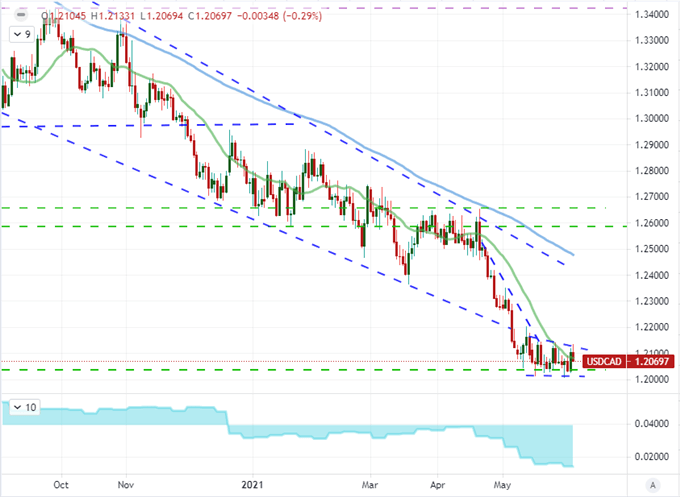
Chart Created on Tradingview Platform
A good example of how markets are poorly positioned to convert technical build up to substantial breakout release is AUDUSD. The cross had a head-and-shoulders pattern without a larger head-and-shoulders pattern. The smaller of the technical progressions broke late last week with the normal neckline giving way to expectations of a reversal, but the 0.7700 clearance lasted for a mere day. Friday’s NFP reaction reversed the markets course and all the pent up potential from that self-fulfilling setup is likely spent. Such technical layouts can draw remarkable interest, but formed in the wrong backdrop and the opportunity can all but fall apart.
Chart of AUDUSD with 20 and 100-Day Moving Average (Daily)
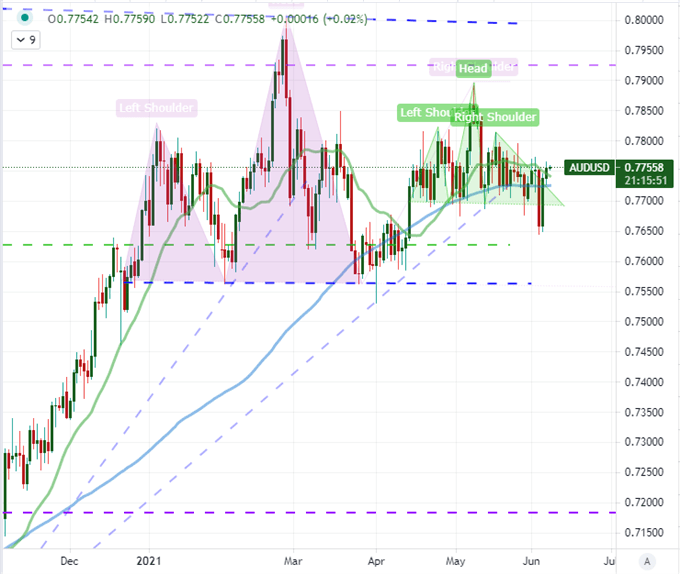
Chart Created on Tradingview Platform
Interestingly, retail traders didn’t seem to buy into the ‘neckline break’ when it occurred last week. Taking a look at FX positioning from the IGCS, we can see that with the bearish slump, shorts cut their position quickly while bullish interests soared to fight the move. When price action reversed quickly, so too did this speculative pivot. Retail traders often exhibit bad habits that reflect the lesser experience in the group at large, but sometimes those preferences align to market conditions. A preference for range and expectation of frequent reversals seems to have worked in favor of the group this time.
| Change in | Longs | Shorts | OI |
| Daily | -4% | -5% | -4% |
| Weekly | 6% | 7% | 6% |
Chart of AUDUSD and IG Retail Trader Positioning (8 Hour)
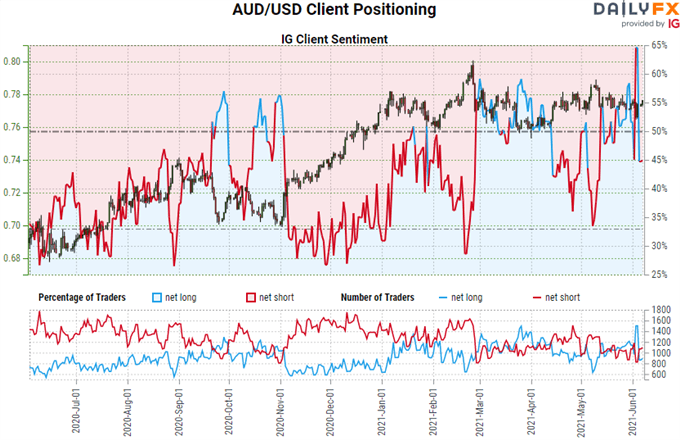
Chart Created on DailyFX
While the pressure for US indices and Dollar crosses is perhaps more recognizable than many other areas, that isn’t where the congestion is isolated. Another particularly acute restriction shows up in Pound-based crosses. GBPUSD has seen its past 20-day range cover the narrowest spans since December 2019 – a remarkable restraint with 1.4300 representing the midpoint of the 2014 to 2020 bear range. That isn’t the most extreme of the curb however. EURGBP’s monthly trading range is the most restrictive since 2008 while GBPCAD’s doesn’t have precedence as far back as I have data. Keep a close eye on the Sterling crosses.
Chart of EURGBP with 20 and 100-Day Moving Averages with 20-Day Historical Range (Daily)
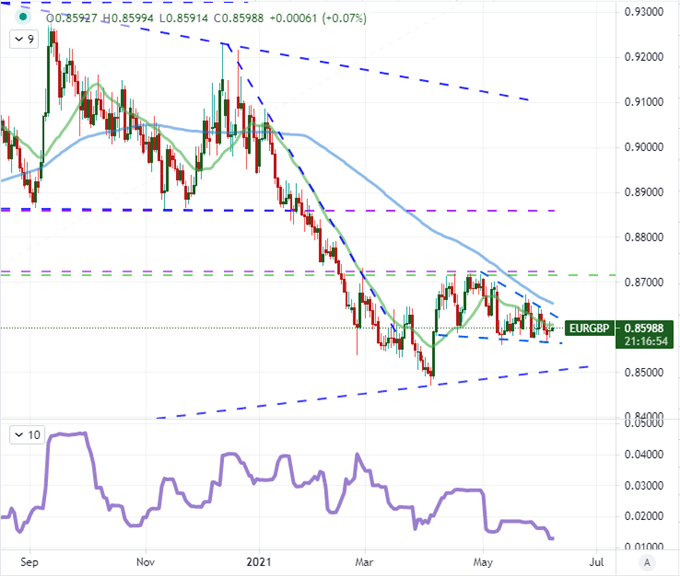
Chart Created on Tradingview Platform

.


