

S&P 500, Dollar, AMC, USDCAD and USDTRY Talking Points:
- Full speculative liquidity is back online after the extended US and UK holiday weekends, but the bearing on risk appetite has not be clarified
- Interest rate speculation remains a top concern for the Dollar as warnings of US labor shortages add to inflation concerns
- While there are highlights for event risk, like the Aussie Dollar’s response to RBA and Aussie GDP, a broader volatility impact has followed EM currencies
Topping Off Liquidity Stirs Volatility But Still a Mixed Risk Picture
After an extended holiday weekend, the US and UK markets are back online and contributing to liquidity. While there remains a structural curb on intent influenced by a market running far beyond its fundamental moorings, there has been a notable jump in volatility for certain assets following critical themes (eg inflation) or are currently being bombarded by scheduled event risk (eg the Australian Dollar). One notable slip this past session which brings uncertainty back into the picture for Wednesday was the slide from US markets which started almost immediately after the a strong opening gap. The S&P 500 posted an eighth consecutive bullish gap on the open only to end the day with a slight loss relative to Friday’s close. This has left us with a decelerating rally from the sharp May 19 reversal…and just shy of retaking the record high set a month ago.

Chart of the S&P 500 with 100-Day Moving Average and 4-Day Historical Range (Daily)
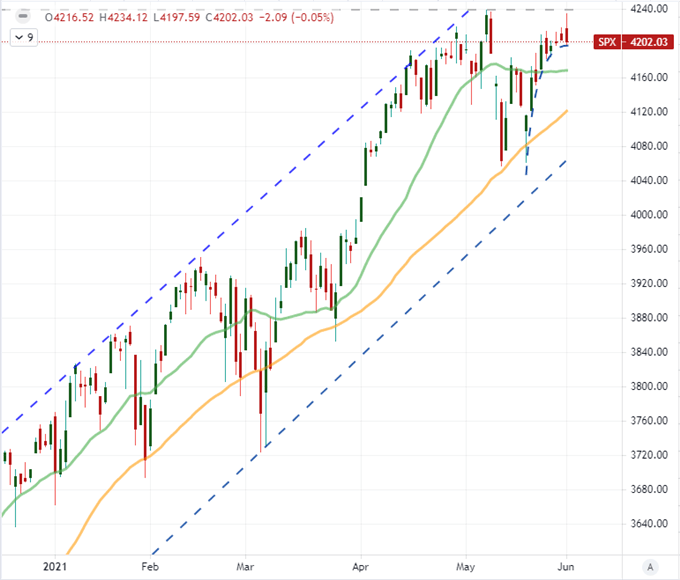
Chart Created on Tradingview Platform
General risk trends remain disjointed; and pushing record highs against a backdrop of lagging fundamental support, conviction is of ever-greater importance. I maintain that the prevailing trends of the past year and years are bullish for speculative measures like the US indices, but the greater ‘potential’ (in other words the more aggressive move) would be a shift towards outright risk aversion. For the time being, there is no clear undercurrent to follow across the entire market, but there are still highlights for performance. The Nasdaq 100 to Dow ratio highlighting the preference of tech shares – the leading thematic over the past five years – slipped a little further this past session. The cryptocurrency market seems to have lost a lot of the shimmer of the first three months of the year with Bitcoin carving out a wedge following its head-and-shoulders breakdown last month. Meme stocks seem to be the asset du jour with the BUZZ ETF riding high but short of March and April peaks, while AMC has picked back up the torch. The stock looks little change until you realize the doji came after a remarkable 22 percent gap to the upside – and the market proceeded to rally another 20-plus after the close.
Chart of AMC and 20-Day Mov Avg Disparity Overlaid with BUZZ ETF and Nasdaq 100 (Daily)
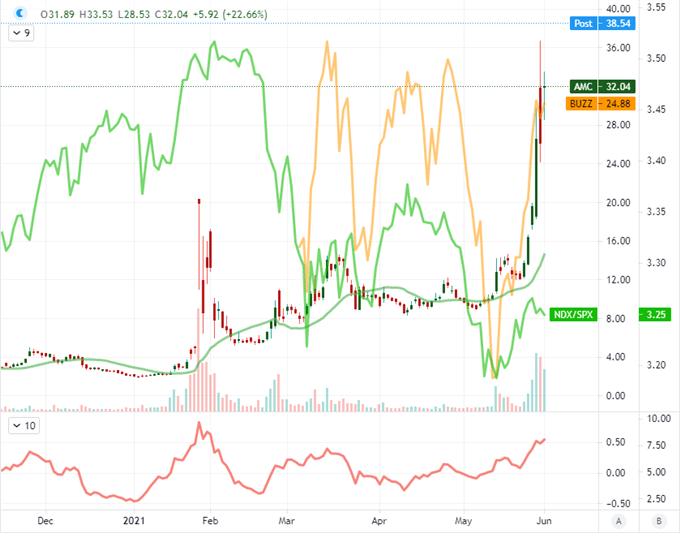
Chart Created on Tradingview Platform
Inflation and Interest Rate Speculation Return to the Frontal Lobe
For broad market themes, inflation seems destined to blot out the fundamental radars once again this week. Google search interest around ‘inflation’ has eased slightly from the previous month but search around ‘taper’ in the US continues to push higher. Recall that the end of this past week saw the release of the Fed’s favorite inflation measure (the PCE deflator) which shot to its highest reading since 1992. Adding to that notion, the ISM’s manufacturing report offered a better reading for May, but beyond the headline were reports of raw material and labor shortages that feed inflation fears. The US Chamber of Commerce warned that it viewed the mismatch of Americans for opens jobs a critical risk for the business sector. Add in there frequent Fed rabble rouser James Bullard’s remarks that labor markets are likely tighter than it looks and the Friday NFPs takes on an even greater weight. Only this time, I the average hourly wage component may be just as important – if not more so – as the net change in payrolls.
Chart of PCE Core Consumer Inflation and Average Hourly Earnings Growth (Month)
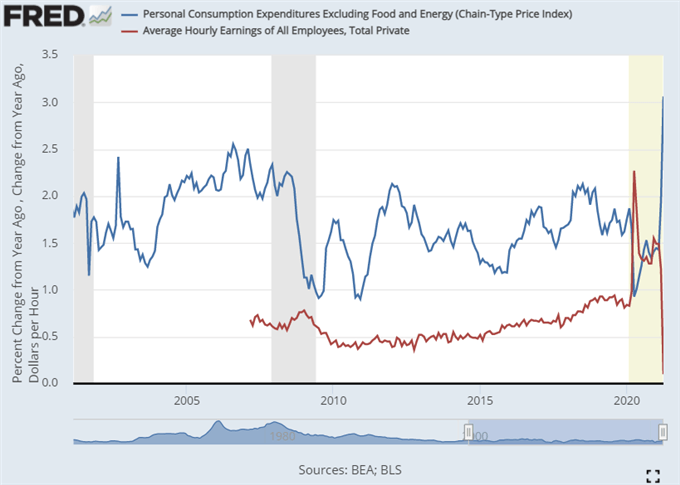
Chart Created on Tradingview Platform
The potential for the Fed to be forced into a faster timeline for normalizing monetary policy than the market at large is comfortable with doesn’t seem to have conferred much benefit to the Greenback just yet. The DXY Dollar Index slid through Monday but found a bounce this past session. This doesn’t seem to be as much a fundamental response to the manufacturing data or renewed rates speculation as a mere lack of momentum to make an earnest bid to clear the past two weeks’ range low which would put a critical multi-year trendline under fire. Pushing EURUSD above 1.2350 or GBPUSD through 1.4300 would be a serious escalation. A definitive view for the Fed’s intentions or comprehensive run for risk trends may tip the scales; but short of that, the currency may wait for high tide.
Chart of DXY Dollar Index Overlaid with 20-DMA (Daily)
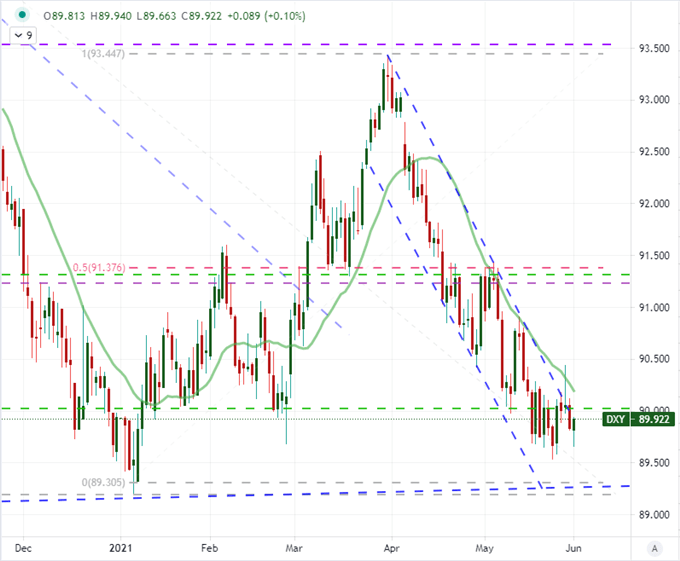
Chart Created on Tradingview Platform
A Heavy Economic Docket Charges Key Majors and Emerging Market Pairs
Among the Dollar-based crosses to that draw more interest, the economic docket can be a good supplement to simple chart based patterns that are struggling to gain traction on their own. EURUSD was interesting for the stronger Eurozone inflation figures and downtick in unemployment, but that didn’t clarify much. AUDUSD is clearly one of the more saddled of the pairs with the RBA rate decision Tuesday morning and Aussie 1Q GDP update this morning (stronger at 1.1 percent annual growth versus a 0.6 percent expected), but the currency isn’t capitalizing whether against the Dollar or other crosses. Top of my watch list for potential remains USDCAD. Another, tentative dip below 1.2035 likely flustered many retail bulls looking to fade the bear, but the data (Canadian GDP and manufacturing) seemed to give a fundamental pass on inertia. This remains a pair to watch as a break is inevitable – but conviction in follow through is not.
| Change in | Longs | Shorts | OI |
| Daily | 17% | -5% | 3% |
| Weekly | 66% | -14% | 6% |
Chart of USDCAD with 20 and 100-Day Moving Averages (Daily)
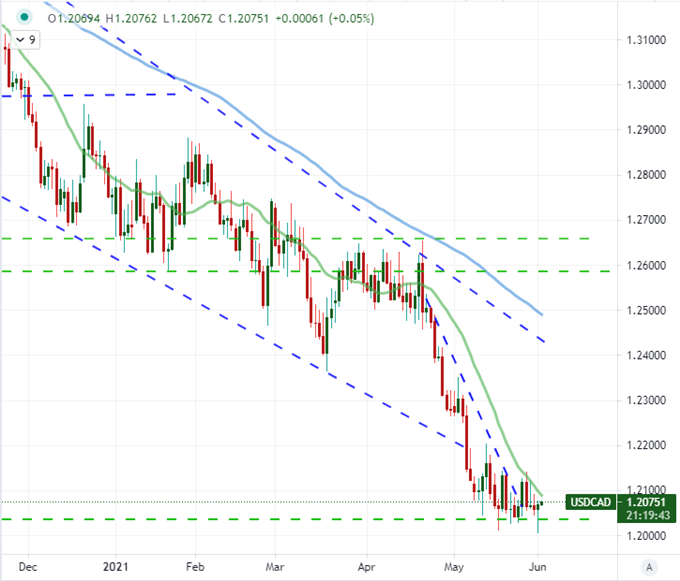
Chart Created on Tradingview Platform
While the majors are of great interest themselves, it seems the volatility and technical progress in the emerging market (EM) currency world could present a unique bright spot for activity. There is a lot of EM data on tap for this week which could knock this segment a little further out of the sphere of the inert risk trends. With Fed speculation still top of mind, traders should remain vigilant, but there is no missing noteworthy breaks like the USDBRL (US Dollar – Brazilian Real) break below 5.2000 which has been a trailing support for the past 15 months. A full break, however, would come below 5.0000; but I find it improbable that a full-tilt break will come through here should other markets continue to struggle..
Chart of USDBRL (Daily)
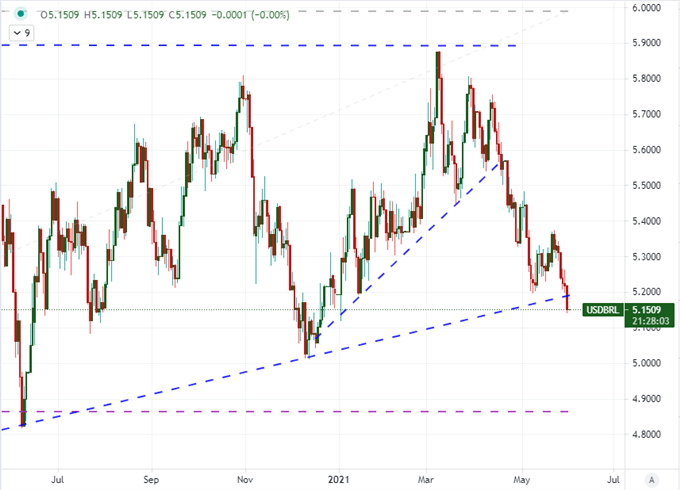
Chart Created on Tradingview Platform
One EM cross break that is not trading in larger ranges comes from USDTRY. The Turkish Lira was put back under pressure back in March when President Erdogan fired the central bank governor and later the deputy head. His replacement seemed to hold a lot of similar beliefs on high interest rates as the President, but two official monetary policy decisions came and went without a move by the monetary policy authority. That honeymoon seems to be over, however, with reports that Erdogan said to the central bank leader that interest rates should be lowered. The next meeting is scheduled for June 17th.
Chart of USDTRY with 20 and 100-Day Moving Averages (Daily)
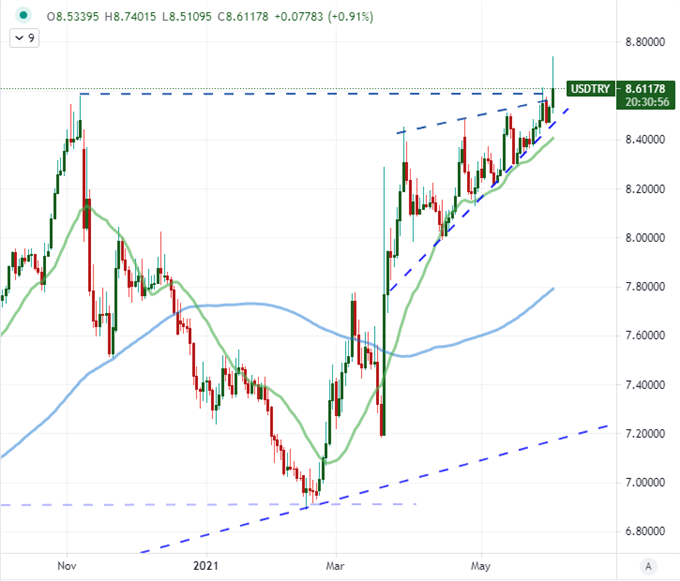
Chart Created on Tradingview Platform

.