


S&P 500, Nasdaq 100, Dollar, EURUSD, USDJPY and USDCNH Talking Points:
- While there was a swell in volatility this past week, risk benchmarks like the S&P 500 refused to find a clear direction through the week
- Given the persistent pressures from the inflation fears and rate forecasts against a calendar of consumer confidence and the PCE deflator, the Dollar will be a focal point
- The DXY Dollar Index has proximate technical barriers, but certain pairs – like USDJPY, USDCAD and USDCNH are facing more immediate breakout risks
Sentiment and Thematic Concerns Direct Risk Trends as the Docket Thins Out
There was a remarkable bout of volatility in capital markets this past week, but the storm did nothing to determine a clear bearing for market participants. In the week ahead, the scheduled potential catalysts to urge the market along thin out but the technical picture suggests traders should remain on their toes. The US indices and Dollar are great examples of a market with diminishing range attempting to fend off persistently elevated activity levels. Combined, those conditions often lead to a break. However, there is a material difference in a break that merely runs out of room (a ‘break of necessity’) and one that is charged with fundamental conviction. From my preferred, imperfect measure of sentiment, the S&P 500, the past week was split between an accelerated tumble that turned into a recovery through the second half of the week. Ultimately, the weekly candle was a doji with a large lower wick that smacks more of indecision than a ‘buy the dip’ mentality that is building up to another productive bull leg. Nevertheless, the range of the past 30 trading days is fairly constrained while activity levels continue to swell. I will be watching 4200 and 4050 closely in the week ahead to see if progress prompts any avalanches in momentum.

Chart of S&P 500 Overlaid with 20, 50 and 100-DMA, 30-Day Range and 30-Day ATR (Daily)
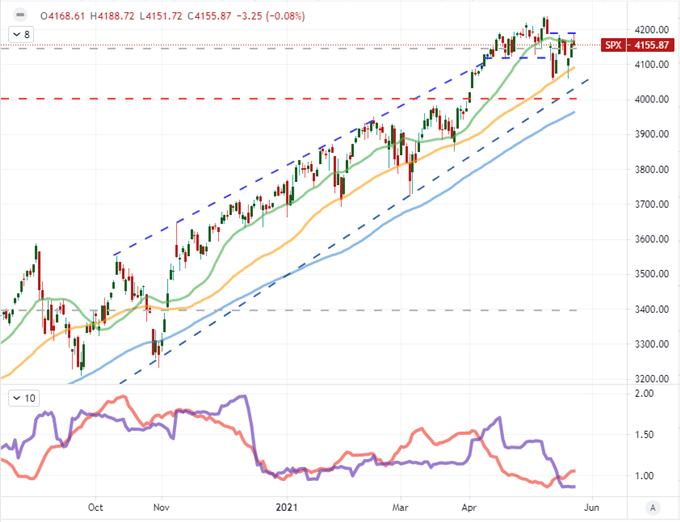
Chart Created on Tradingview Platform
A stir deep in risk trends can take time to rouse. Looking for earlier signals to shifting winds n sentiment – though they tend to also produce more false signals – the comparative performance of the Nasdaq 100 to the Dow Jones Industrial Average remains one of my preferred metrics of late. That said, the recovery from the concentrated view in tech interest as a speculative leader slipped to end this past week. Broadly speaking the chief disruption sector has consolidated for the past 10 months and progressed in a timed H&S reversal over the past three months in particular. The break through support on this pattern two weeks ago did not usher in a full unwind, but it seems this is more indecision than the foundation of a ‘false break’ recovery. Watch the relative performance of the US equities’ tech sector as well as the overall performance of cryptocurrency in the week ahead as a compass setting for sentiment.
Chart of Nasdaq 100 to Dow Ratio Overlaid with S&P 500 (Daily)
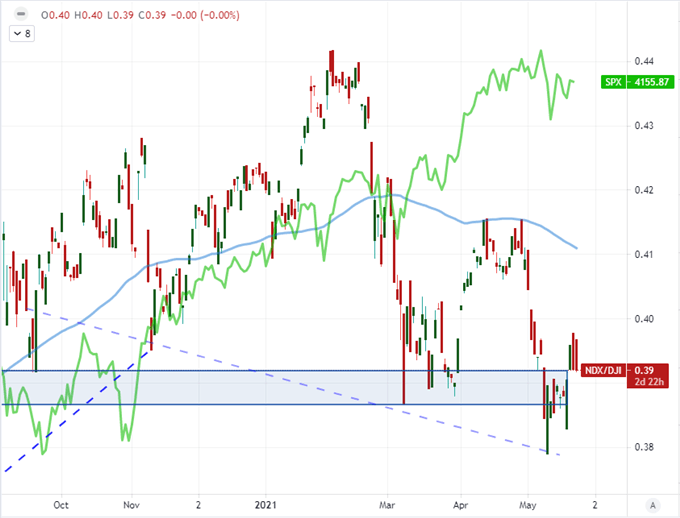
Chart Created on Tradingview Platform
The Dollar Sources Support from PMIs, Inflation Fears Still a Leading Spotlight Ahead
Through the very end of this past week, the Dollar found reprieve…again. While there may have been a modest risk aversion contribution to the Greenback’s bounce, the real motivation seemed to come to the relative growth potential shaped by the monthly PMIs from Markit. The group reported the United States’ composite reading jumped from 63.5 in April to 68.1 in the current reading. This is a remarkably useful proxy for GDP, so the recent record high reading registers as a comparative advantage in economic terms for the Greenback – not to mention the implications for a more hawkish Fed forecast. The Friday rally, however, did not break the indecision that has kept the Greenback to congestion and a broader descending trend channel. There is still some technical room to traverse before we come upon serious ‘breakout’ points (I consider breakout to be omni-directional). To the topside, we have the channel resistance and 20-day moving average at 90.50. The 89.70 level is immediate support, but the real weight is the multi-year support (back to 2014) that falls around 89.25.
Chart of the DXY Dollar Index Overlaid with the 20 and 100-Day Moving Average (Daily)
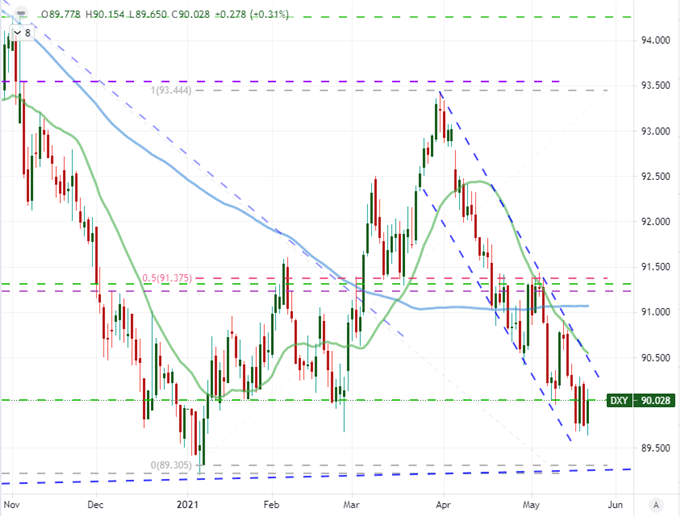
Chart Created on Tradingview Platform
A Run of Dollar Crosses
Looking ahead to next week, the technical potential of the Dollar will find me tracking the meaningful event risk closely. Key Fed speak on Monday (one of the most dovish members, Lael Brainard), the US consumer confidence survey from conference board, a run of data and President Biden’s budget proposal on Thursday, and the Fed’s favorite inflation figure (PCE deflator) on Friday make for a hearty list in an otherwise quiet period. With that data in mind, EURUSD will be a pair on my radar. The largest component of DXY, this cross has near-term technical barriers of 1.2250 and 1.2100. The bigger lift would be a break above 1.2350 while a move below 1.2000 would be this pair’s ‘path of least resistance’.
Chart of the EURUSD Overlaid with 20 and 100-DMAs with 4-Day ROC and ATR (Daily)
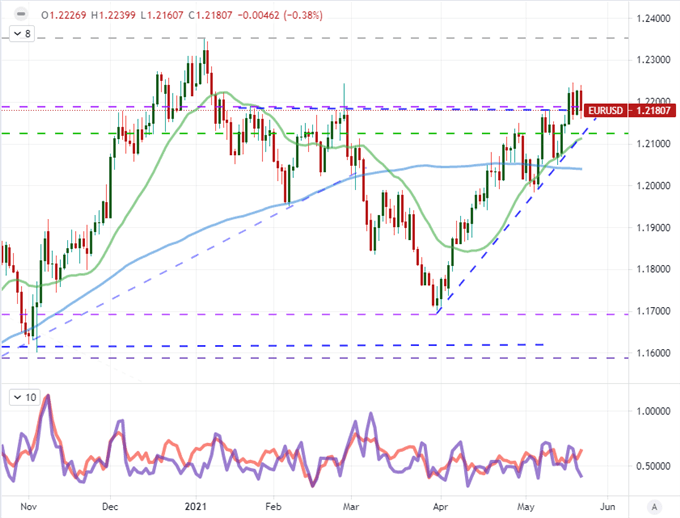
Chart Created on Tradingview Platform
For EURUSD, the ‘easier’ technical bearing – a course that requires less conviction both technically and fundamental – is one that is Dollar bullish. USDJPY is facing the opposite situation. A break of 109.75 finds the late-March 111.00 swing high as a subsequent overhead, but a bearish break of 108.50 is a more immediate tipping point for bears intent of moving the cross back into a multi-year range. This pair is likely to find urged by moderate moves in risk trends (as the Dollar is a last resort safe haven) or a capsize in the Greenback’s fundamentals.
Chart of USDJPY with 20-Day Moving Averages (Daily)
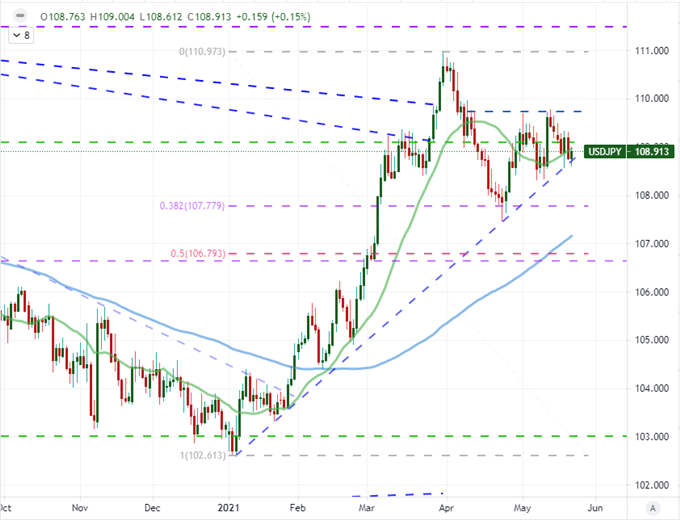
Chart Created on Tradingview Platform
Another Dollar-major that has been on my radar these past weeks is GBPUSD. This cross attempted and fell short a second time (to the February effort) to overtake the 1.4250 level. Shifting to a weekly charge, we can get better context as to the importance of resistance a little higher up at 1.4300. That level is the midpoint of the 2014-2020 range and also happens to fall in line with the 2018 double top. There is a lot of resistance overhead which means there is greater influence but likely also a heavier reticence to pursue a bullish break. A move back to and below 1.4000 is easier to achieve, but the next technical steps below that may make the higher probability bearing a choppy one.

Chart of GBPUSD with 20-Week Moving Average (Daily)
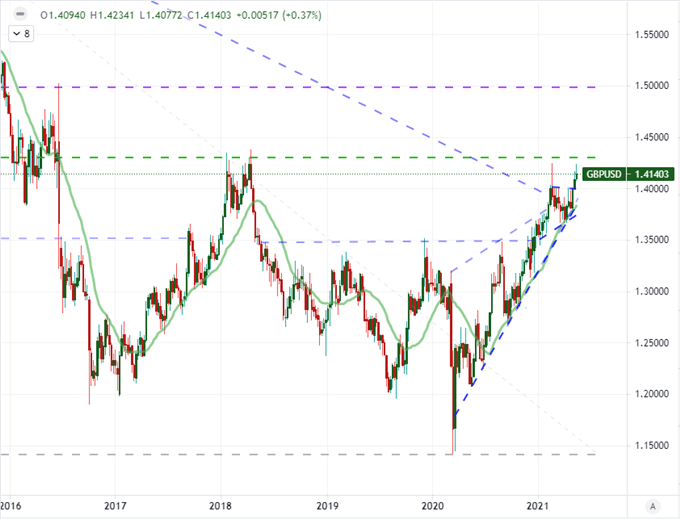
Chart Created on Tradingview Platform
While I am keeping close track of a wide range of Dollar based pairings (including USDCAD and AUDUSD), I do want to call attention to one particular pair that gets far less attention under normal circumstances. USDCNH is driven as much by political influence as traditional market forces, so this pair can be a complicated fundamental tuning. Technicals, on the other hand, are showing the building pressure for a technical breakout on a rapidly dwindling wedge. A break below 6.4000 would upend a long-term technical support but it would also disadvantage China in trade tariff terms. A bullish resolution would require far less conviction and it would cater to other areas of speculation like a Fed rate hike and comparative growth expectations. I don’t expect most people to be active on this pair as a unique outlet or strict representative of the Greenback, but it is worth monitoring.
Chart of USDCNH with a 20-Day Moving Average (Daily)
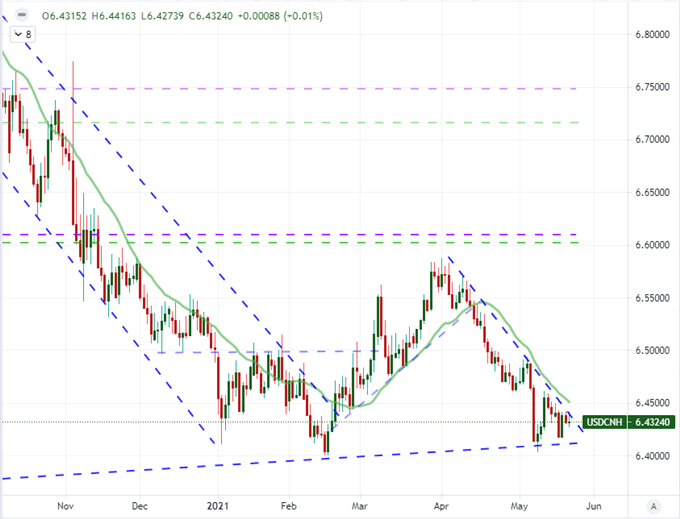
Chart Created on Tradingview Platform

.


