


S&P 500, Nasdaq 100, Bitcoin, Dogecoin and US Dollar Talking Points:
- Risk trends are still in recovering from Wednesday’s slump, but there is increasingly a preference for momentum candidates like Dogecoin and Nasdaq
- There is a distinct ‘buy the dip’ drive in broader markets which suggests short-term intentions unless a key fundamental driver adds to momentum – like the May PMIs
- While a sentiment response to the growth data depends heavily on the mood markets are in Friday, the Dollar’s scenarios look more distinct
More of the ‘Buy The Dip’ Mentality
Over the past 48 hours of trade, we have seen a sharp reversal in bearing for the speculative markets; but volatility has held consistently elevated. Such a backdrop is not particularly conducive to establishing wayward trends though it conversely raises the risk of sudden reversal and even short-term technical breaks. It is this systemic market backdrop that can determine how well technical developments follow their textbook archetypes or whether an event risk can turn surprise into a meaningful response in price action. While Thursday’s session saw an advance in US indices, emerging market assets, carry trade and other ‘high beta’ markets; there remains a notable preference for the assets that promote short-term acceleration rather than long-term value. This can show through in a variety of similar habits, but the most accessible is the ‘buy the dip’ mentality. While I’m monitoring the likes of the S&P 500 as it eyes 4,175/4,200, my preferred measure for a litmus test of the markets-at-large is the performance of the Nasdaq 100 relative to the Dow. That is the consummate growth versus value performance in recent years, and it has charged higher these past few days.

Chart of Nasdaq 100 to Dow Ratio with 20-Day and 200-Day Mov Avgs and 3-Day ROC (Daily)
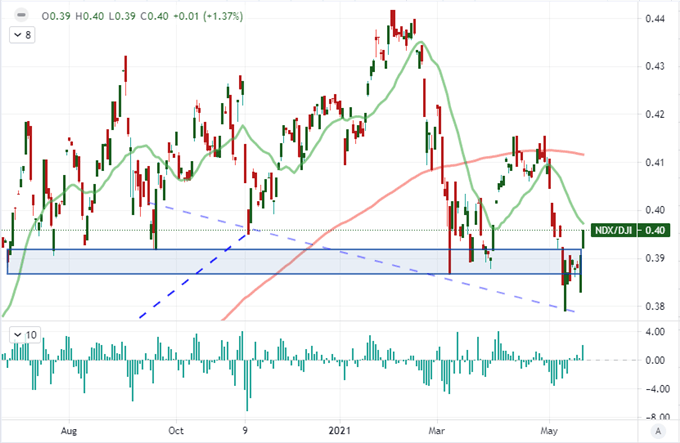
Chart Created on Tradingview Platform
Another measure of risk appetite using close comparisons for an asset class that is particularly popular among the trader crowd, we can see the strength of the recovery in high profile cryptocurrencies favoring the more intensely speculative coins. To be fair, the plunge that we witness through midweek registered greater losses further down the market cap curve with Bitcoin suffering an open-to-trough plunge of 30 percent, Ethereum dropped as much as 45 percent and Dogecoin 55 percent. In the recovery since that low, we have seen the intensity hold – volatility begets volatility. Dogecoin reversed nearly 60 percent higher, Ethereum 50 percent and Bitcoin 35 percent. Doge is a meme coin that has found little practical adoption by the financial system, but it has experienced the most extraordinary rally through 2021. If you are looking for a particular sensitive gauge for risk trends, this is the area to watch. Of course, endogenous risks like the reports that the US Treasury will demand crypto transfers of over $10,00 be reported can throw its calibration for the market off.
Chart of Bitcoin, Ethereum and Dogecoin Performance from Wednesday Low (10 Minute)
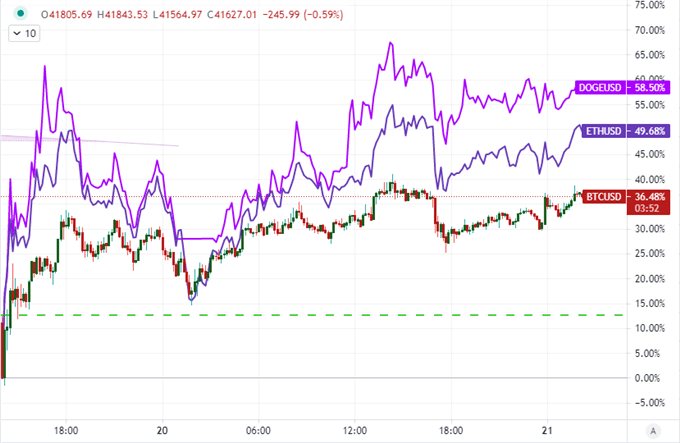
Chart Created on Tradingview Platform
The Most Potent, Scheduled Event Risk to End the Week
Recent volatility suggests that not all of our market activity potential is rooted in scheduled events. In particular, the persistent concern around inflation and monetary policy normalization (particularly in the US) will remain in the forefront of my mind as its reemergence could readily take over. Barring the upheaval of the turbulent theme, there is a distinct theme on tap to end this week around economic activity. In particular, we are due the first readings of the May PMIs for some of the largest developed economies from Markit. These indicators are strong proxies to the official GDP figures that so often come out at a delayed quarterly pace. Therefore, they can feed intense speculation around the pace of economic recovery and the debates over which currency leads rate forecasts.
US, UK, Eurozone, Japan, Australia and China Composite PMIs (Monthly)
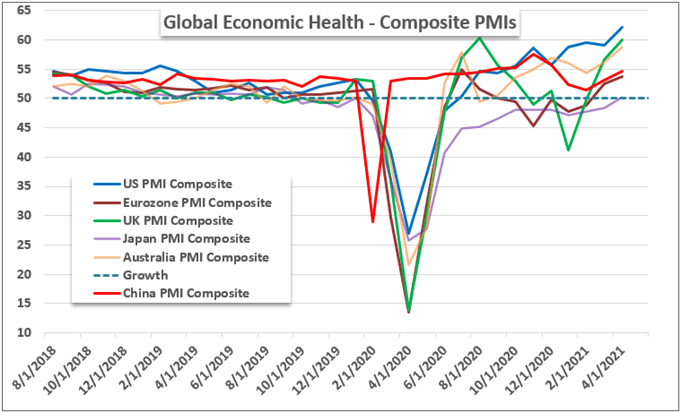
Chart Made by John Kicklighter with Data from Markit
In a growth update, there are clear implications for risk trends. However, if the market maintains a glossy-eyed bias supporting the buy-the-dip complacency, it is possible that the data can be interpreted favorably regardless. For example, if the global measures show broad improvement, it could be registered as a bullish mentality for capital gains based on economic tempo. Alternatively, a sharp downturn in the measures similar to recent US sentiment surveys could lead enthusiasts to speculate that the Fed can use the data as justification to push out the moderation of monetary policy even further. The Dollar’s perspective on the other hand is less likely to be so murky. If risk appetite persists regardless so the outcome, it could curb the nascent safe haven boost. Should the US data disappoint relative to global counterparts, it will undermine the currency on a linear basis. On the other hand, a strong data print is likely to nudge the more yield sensitive currency into another switchback. The past three days for DXY is back and forth. There is plenty of range to move through end of the week, but we will soon need to resolve the descending channel from the beginning of April and the massive trendline support down at 89.50.
Chart of the DXY with 1-Day Change, US 10-Year Yield and Implied Rate Fed Funds Futures (Daily)
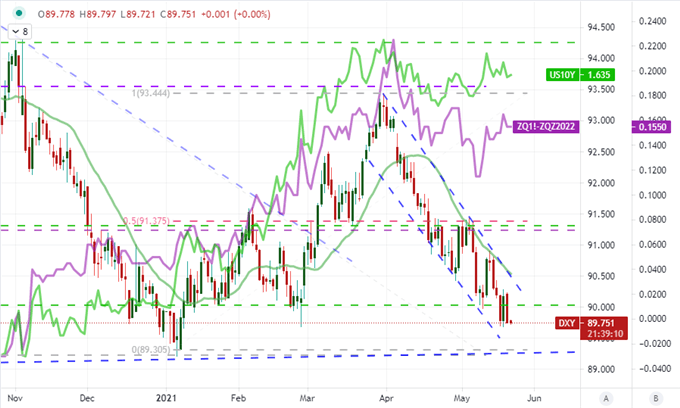
Chart Created on Tradingview Platform
The Dollar Crosses to Watch Through Friday
With the Dollar’s ability to respond to the upcoming data more decisively, I will be looking to crosses that either offer clean technical patterns or have counter currency event risk to leverage the potency even further. USDJPY falls into the former category. This pair actually struggles for a clear bearing. Risk trends is an encumbrance sometimes given both currencies act as safe havens against a broader set of currencies but it offsets in the pairing. Nonetheless, we are stagged at immediate support tracing back to the reversal low that opened 2021 – now around 108.75. Path of least resistance is higher, but this would be an interesting candidate should the Dollar enter another leg lower – but before we take out the larger Greenback support.
Chart of USDJPY with 20-Day Moving Averages (Daily)
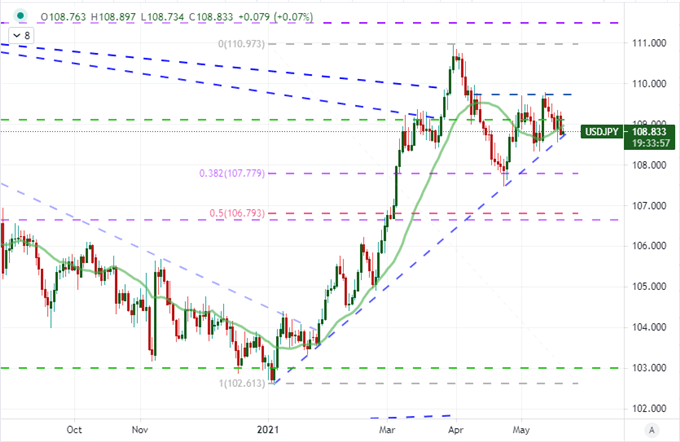
Chart Created on Tradingview Platform
The technical barriers on GBPUSD are far more profound. To the topside 1.4300 is not far off and that figure represents the range high stretching back with tests over multiple years and it also happens to coincide with the midpoint of the 2014 to 2020 range. Lower, there is interim support at 1.4000 while the channel floor is tracing out closer to 1.3850. Given that we are over 100 points away from either barrier, there is movement that would need to happen to merely get to the border, much less break it. That said, if the UK and US PMI offer clear contrast and subsequent UK retail sales adds to the mix, there is potential here outside a range swing.

Chart of GBPUSD with 100-Day Moving Average (Daily)
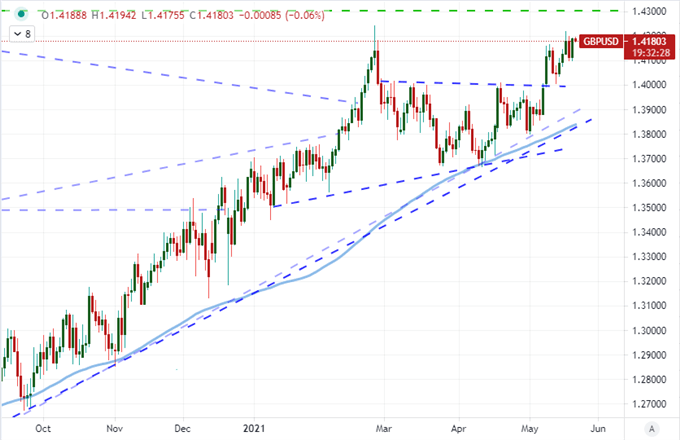
Chart Created on Tradingview Platform
Finally, I will keep a very close eye on USDCAD. The technicals here were a false start reversal from the accelerated decline over the past four weeks which fell apart alongside the Dollar’s failed recovery yesterday. There is a terminal congestion here where the accelerated bear trend is hitting long-term support at roughly 1.2000. This pair is stretched in a longer-term trend with breakout potential in the short-term and data on tap. While Canada won’t have a PMI to stir the pot, we do have Canadian retail sales.
Chart of USDCAD with a 100-Day Moving Average (Daily)
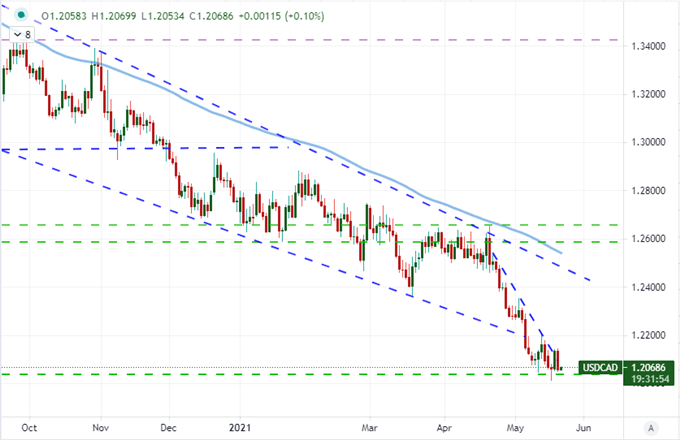
Chart Created on Tradingview Platform

.


