


Ethereum, Bitcoin, S&P 500, Dollar and EURUSD Talking Points:
- Ethereum has leap frogged Bitcoin in its drive to record highs, but Warren Buffett and Charlie Munger think the charge akin to gambling
- While the S&P 500 is still hovering at record highs, the six-day historical range is still extremely restrained and enthusiasm lacking
- The Dollar Friday rally wouldn’t carry over to the new trading week with EURUSD, GBPUSD and USDJPY moving back to range

The General Investor Clash
Over this past week, Warren Buffett and his deputy Charlie Munger held the Berkshire Hathaway Annual Shareholder meeting. Both men are phenomenal investors and consequentially they are both in their 90s. Few renowned people of the market will make it so long and build up such incredible wealth over an extended period of time (Buffett is worth over $100 billion and has been investing for over 80 years) by chasing every speculative craze. Then again, innovation in outlook and valuation for projecting the changes in the financial landscape are essential to staying out of the chop. That is the context we should consider when digesting some of their critical rhetoric for some of the most extraordinary trends in our markets at present. Munger outright said of Bitcoin – and by proxy other crypto – that he “hate(s)” its progress and that he sees it development “contrary to the interests of civilization”.
Naturally, those that believe in the idea of a decentralized currency that can circumvent distortions like the central banks and governments disagree vehemently. From my own perspective, I’m skeptical that most crypto will make it in the long run and this degree of volatility doesn’t make for a stable medium of exchange – not to mention regulators are circling like sharks. That said, innovation occurs in starts and fits while ‘markets can remain irrational longer than we can remain solvent’. I do know that Bitcoin is up approximately 500 percent year over year and Ethereum hit a fresh record high this past session in a 9-day rally. Traditional fiat, corporate credit and blockchain are built on market belief. And, my traditional time frame does is not necessitate a ‘ride or die’ mentality that these two sides seem to be taking; so I don’t see a reason to let faith override opportunity.
Chart of Ethereum and Dow 6-Month Performance with Consecutive Candles (Daily)
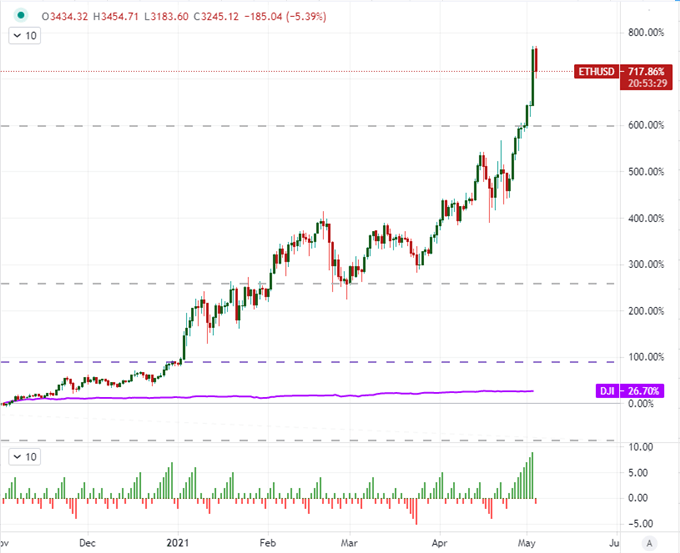
Chart Created on Tradingview Platform
Not all the grumbling at the weekend long-term investor summit was reserved for the crypto market. Buffett would also make clear his disdain for what he considered the enabling of what he considers to be ‘gambling’ in short-term investing which has grown particularly acute during the recovery from the pandemic. His scorn was not targeted at individual investors getting into the market but rather those that had he believed made markets seem easier and perhaps less risky than they truly are. Naturally, he made direct reference of Robinhood which has found something of a cult status, if not inspiring a cultural movement, with its gamifying trading. I myself harbor concerns that many in the market are overlooking overt risks and pushing markets to extraordinary heights, but it was doing that well before the most recent crop entered the market. The S&P 500 has pushed record highs every year since 2013. The present 6-days of indecision may be simply a breather in seasonal quiet or earnest reflection of life choices. I suspect it is the former.

Chart of S&P 500 with 100-Day Mov Avg, 6-Day ATR and 6-Day Range (Daily)
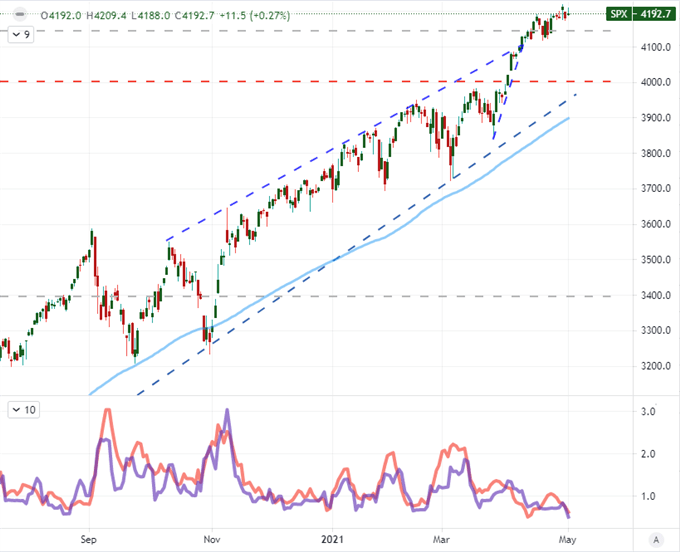
Chart Created on Tradingview Platform
Pushing record highs and the inflow of new investors willing to participate at record high cost that stretches well beyond traditional fundamental values is a debatable issue in and of itself. A believe a little more objective a problem is the use of leverage among the different critical players of the global economy. ‘Gearing’ can be both notional (actual borrowed capital) or thematic (eg overloading into a ‘risk on’ view), but it is present across the board. Below is a more traditional measure of market leverage showing a record margin debt exposure among NYSE brokers, but the scale of short-term options trading or record number of margin accounts among retail traders is often touted in similar conversations. Yet, before we blame the extravagance of the market for all future ills; it is important to note that leverage is topped off for governments, central banks, businesses and consumers. And that makes the situation even more potentially unstable.
Chart of Monthly S&P 500 Overlaid with Margin Debt Levels at NYSE Registered Brokers
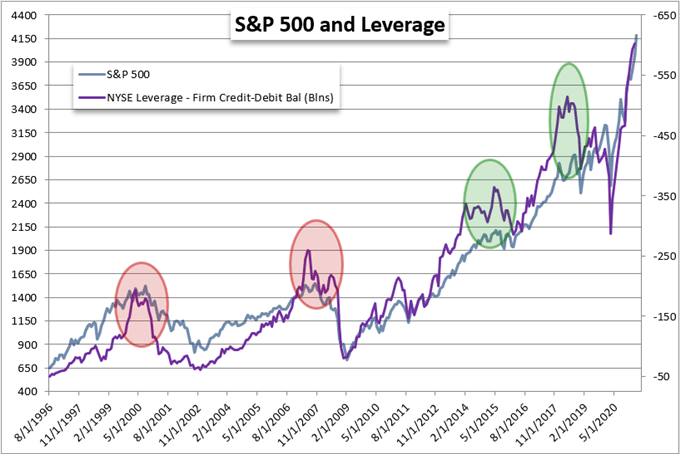
Chart Created by John Kicklighter with Data from FINRA
The Dollar’s Recovery Falls Apart Immediately
Moving away from the debates between old and new investors, we shift our attention to one of the more potent short-term moves of last week. The Dollar managed to post its biggest charge in months Friday following a fairly consistent battering throughout the month of April. This move could have been motivated by a number of factors including an early signal of risk aversion or perhaps as response to the jump in the Fed’s favorite inflation indicator (the PCE deflator), but the retreat we were met with Monday suggests that month-end capital flows was a bigger factor. The Greenback dropped back against most of its major counterparts Monday – though it wouldn’t fully give up its gains and totally dash the possibility of a turn. There is plenty of technical overhead to consider, but look for a fundamental sponsor for either bulls or bears. A drop in the implied Fed Funds forecast poses a risk.

Chart of DXY Dollar Index Overlaid with US 10-Year Yield and Implied Fed Rates (Daily)
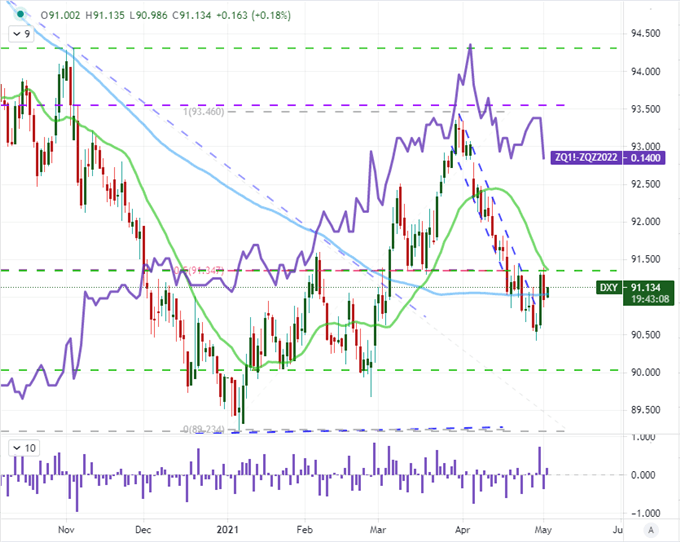
Chart Created on Tradingview Platform
While pairs like EURUSD and USDJPY are interesting Dollar crosses, they perhaps don’t conform as well to range based conditions. More sculpted for such conditions are the likes of GBPUSD, AUDUSD and NZDUSD which offer up more worn congestion patterns. That said, I would point to a couple of pairs that usually are lower down the list. USDCAD, which is shown below, has been remarkably productive in its anti-USD move these past weeks and has stretched well beyond the 20-day moving average to a point often associated to an extreme stretch. It doesn’t have to revert, but it often occurs naturally. Another pair to consider is USDCHF which has not left the bounds of its steady descending trend channel for the past month despite the EURUSD’s slip.
Chart of USDCAD with 20 and 100-Day Moving Average and 20-Day Disparity (Daily)
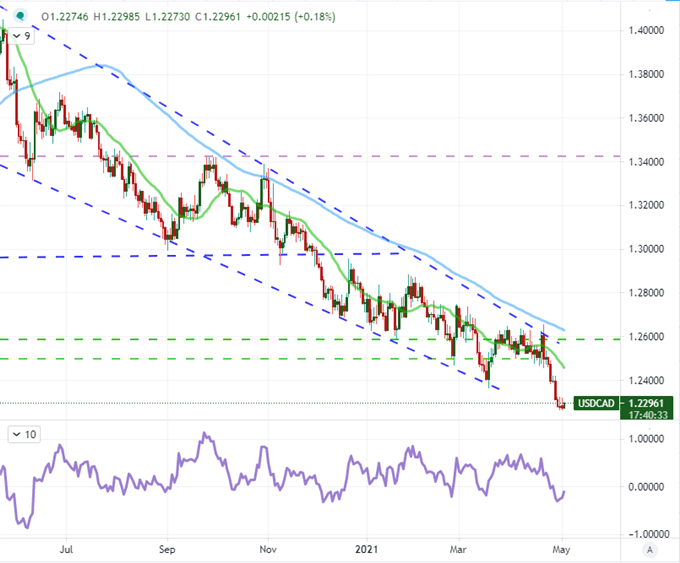
Chart Created on Tradingview Platform
The ‘Traditional’ Fundamentals to Watch
As we work out who is in control of the markets and where their interests now project in such a mature environment, I think it remains important to watch the top level event risk as it crosses the wires. This past session, the ISM released its April US manufacturing activity report. Since this comes after the Markit version, the markets perhaps had tepid expectations and projected an pick up from 64.7 up to 65. Instead, the indicator dropped to 60.7 to remind us that the pace of recovery is not every accelerating. Not that the prices paid component was also exceptionally high which pressures the conversation as to whether the Fed can ignore inflation. My attention is now focused intently on Wednesday’s service sector reading given that segment of businesses account for more than three quarters of output and employment in the world’s largest economy.
Chart of S&P 500 Overlaid with Manufacturing and Service Sector ISM Activity Reports (Monthly)
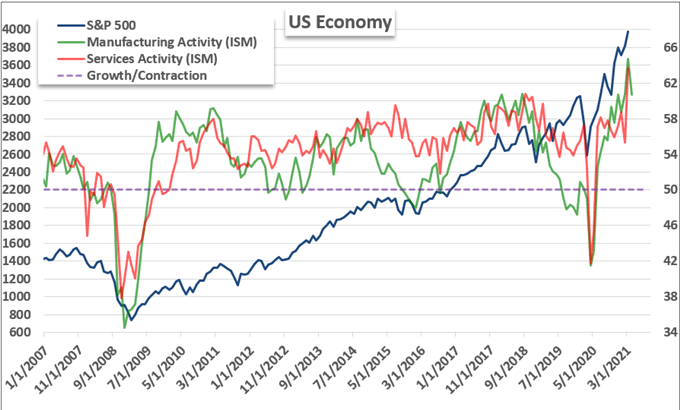
Created by John Kicklighter with Data from ISM
The other traditional fundamental theme to start this week off was in monetary policy. The Reserve Bank of Australia (RBA) was first up to the bat, but expectations were not riding high given the group’s message over the past months that it was seeking to maintain exceptional accommodation even though there were points of concern as in the housing market. The outlook for the other central banks listed for release hold greater anticipation. The Brazilian Central Bank on Wednesday is expected to cut rates by 75 bps, Turkey’s central bank saw its leader replaced in large part owing to a high 19 percent benchmark and the Bank of England will update its quarterly report. Don’t underestimate the influence of central banks.
Chart of Relative Monetary Policy Standing Perception
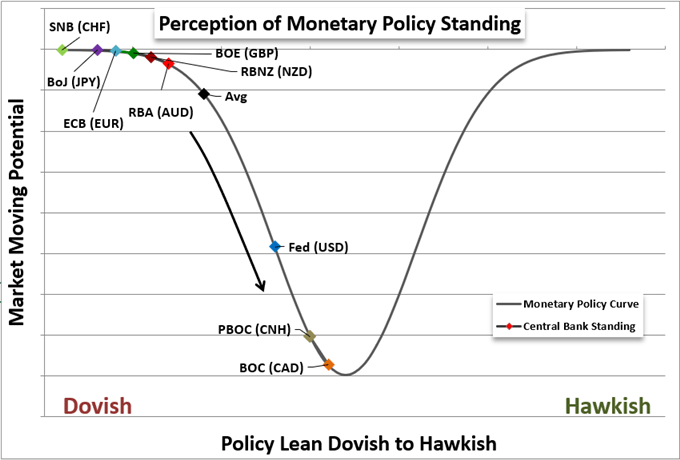
Created by John Kicklighter

.


