


S&P 500, Dow, Nasdaq, EURUSD and USDJPY Talking Points:
- Despite the cumulative tail winds of a committed Fed, Biden pushing stimulus, earnings beating expectations and US GDP swelling; equities slipped
- Top Fundamental target through the final 24 hours of the trading week and month is EURUSD between European GDP and the Fed’s favorite inflation data
- Other pairs to keep a close watch on are EURJPY, EURGBP, USDJPY and USDMXN with interesting features and key data

Everything and the Kitchen Sink to Get Risk Trends to Respond
We are heading into the final trading day of the week and month with the markets stubbornly refusing to metabolize the remarkable run of favorable developments over the past 48 hours. Despite a top off of the Fed vow of support, the US President making the case for further stimulus, Apple earnings bolstering tech’s seeming inverted response to the pandemic and a pre-open US 1Q GDP beat; risk assets trading through the New York session Thursday simply refused to respond. Once again, referencing my favorite but imperfect barometer of speculative appetite, the S&P 500 managed its biggest bullish gap since March 9th and then proceeded to struggle through the rest of the session. While the index managed a 0.7 percent gain ultimately on the day, the 4-day average true range (as a percentage of spot) is still comparable to the lulls of holiday 2019 trade. So, while we can put a record high in the history books, this still does not look like the restoration of conviction.

Chart of S&P 500 with 20-Day Mov Avg, Daily Gap and 4-Day ATR (Daily)
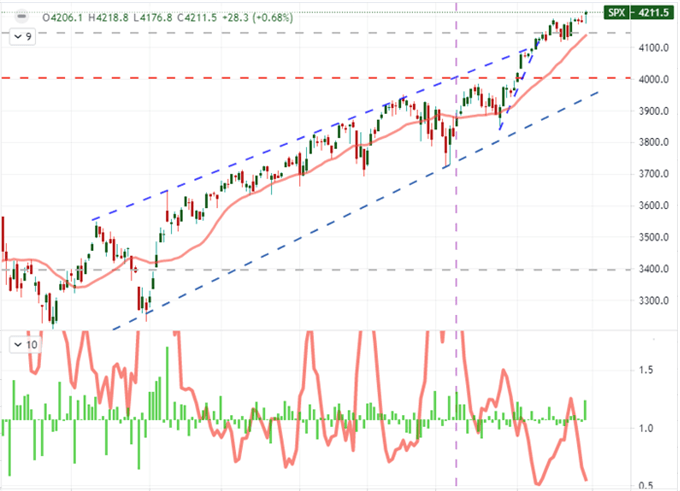
Chart Created on Tradingview Platform
The lack of traction itself would not be so remarkable if not for the context. On the one hand, the months of April and May historically see a seasonal fade in volume and volatility. That occurs with a convergence of structural moderation in sentiment as the ‘recovery from the pandemic’ period runs short on lift – similar to the post-trade war period through the end of 2019. On the other hand, we are pushing record highs and a market adapted to riding on favorable event risk was backed by the most potent mix of short-term growth and investment we’ve seen in a long time. Extending the Fed’s $120 billion per month stimulus infusions, President Biden going to bat for trillions of dollars of stimulus, major companies announcing share buybacks and a 6.4 percent US GDP reading for the first quarter is perhaps the perfect storm of liquidity. A market incapable to converting that into kinetic energy starts to register more and more as inert.
Calendar of Key Macro Economic Events
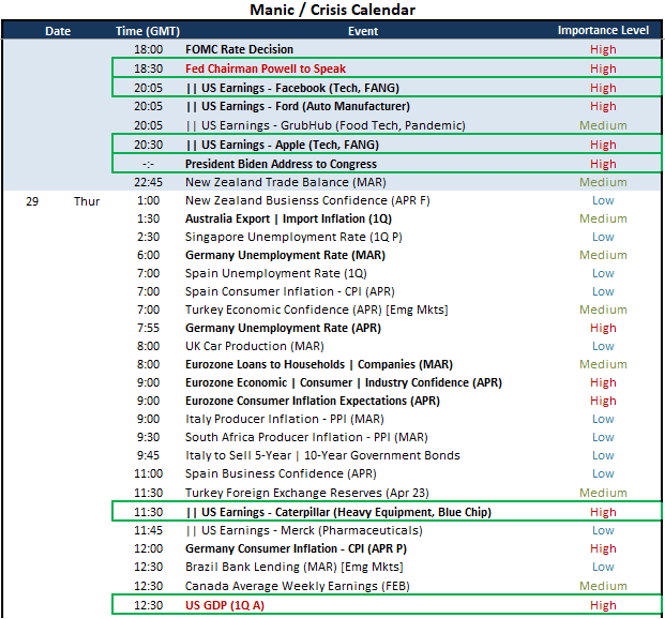
Created by John Kicklighter
Taking a closer look at the speculative makeup in the market, there are certain assets that can outperform and reflect a risk-on spirit even in a low tide of capital deployment. One of those measures as of late is the performance of the Nasdaq 100 – and in particular the tech index’s struggle to outpace the likes of the S&P 500 and Dow. These are all US indices and generally enjoy a high correlation, but between them the preference for momentum and performance of industry that weathered the pandemic better than others has benefit NDX significantly over the past year. That charge has all but fallen apart in the past months and in particular recent weeks. Given the remarkable earnings stories from Google, Apple and Facebook; it is nothing short of incredible that the enthusiasm hasn’t been viral. Perhaps the Amazon earnings beat with $15.79 EPS (versus $10.95 expected) on a 44 percent increase in profits to $108.5 billion reported after the close Thursday will finally awaken the market. I will not be holding my breath however.
Chart of Nasdaq 100 with 20-Day Mov Avg Overlaid with the Nasdaq-S&P 500 Ratio (Daily)
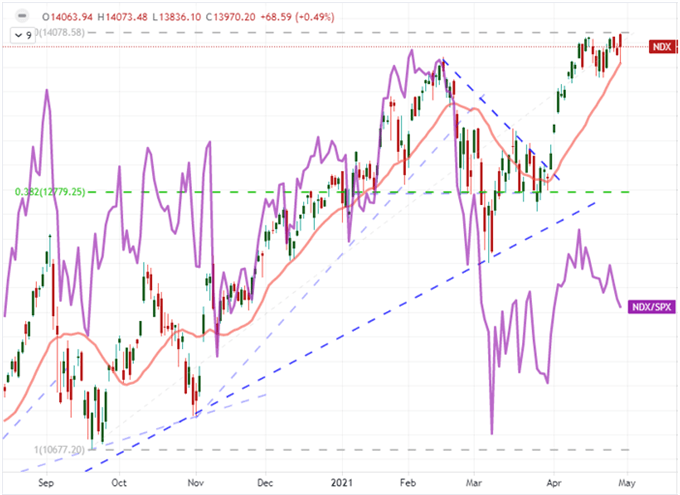
Chart Created on Tradingview Platform
Top Event Risk Ahead Looks More Towards Relative Considerations
Given the market’s general lack of appetite to take advantage of ‘the collective good’, it is worth looking at major event risk from the perspective of its relative potential. The Dollar’s struggle after the Fed rejected fears that it would soon signal the steps towards normalizing in the future led to remarkable moves like the USDCAD’s extended bear trend to fresh three-year lows. It is on that formula that I will look through Friday’s still-impressive economic docket to draw out where the potential may arise. In particular, I’m going to be watching the Euro and Dollar (with their relative capital market performance) particularly close with the calendar we are wading into to close out the week. For the former, we have the critical first look at 1Q GDP figures for the major Eurozone economies. In particular, I will be watching the Italian, German and EZ updates as a key straggler, the anchor and the overview respectively. Beyond that, however, any contrast to the Fed position garnered for the ECB in the regional inflation and employment data should not be underappreciated.
Calendar of Key Macro Economic Events
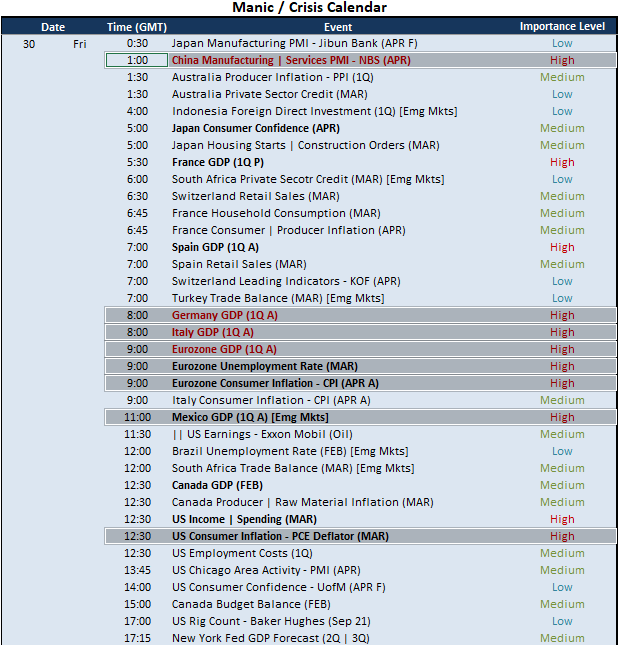
Created by John Kicklighter
On the Dollar side, it would seem that we have already exhausted the fundamental potential through such a heavy docket. That said, the Dollar has taken a persistent hit these past weeks and there has been an impressive reticence to deflate for both US Treasury yields and implied rate forecasts in Fed Funds futures. If the US central bank’s favorite consumer inflation reading (the PCE deflator) signals building pressure against Powell and Co’s dovish stoicism, a quick turn could be triggered in a range-like swing.

Chart of US 10-Year Yield Overlaid with DXY Dollar and Implied Fed Rates with Correl (Daily)
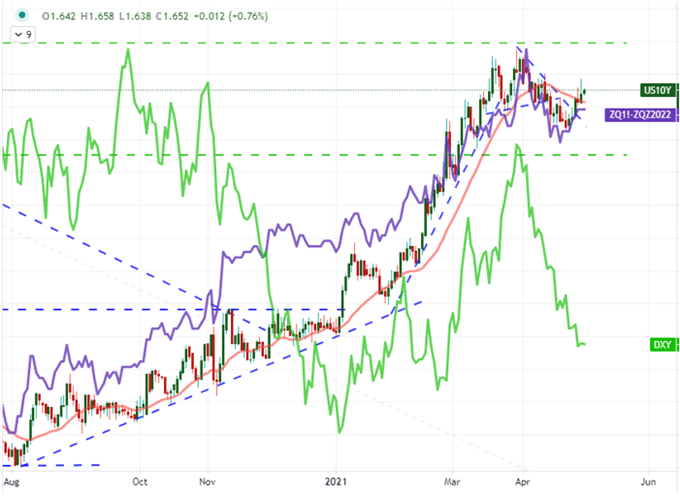
Chart Created on Tradingview Platform
The Major FX Pairs to Watch Through This Final Session
Given the event risk on hand, I will be looking for those pairs that can capitalize on event risk for range purposes (through Friday and early next week) or are otherwise facing a skew to potential scenarios. There are some interesting cases to be made for USDCAD as it extends its usually productive trend, USDJPY capped at 109 and USDMXN with Mexican GDP ahead. However, it is the event risk referenced above and a remarkably persistent trend for EURUSD that has my interest. Data could very well support a bullish extension in the prevailing bias bouncing off channel floor at 1.2100, but that would not interest me much. Alternatively, if the Dollar could regain some lost traction, a break on such a productive one-way bias back into a range built over the past month could urge more significant movement.
Chart of EURUSD with 50-Period Moving Average (4 Hour)
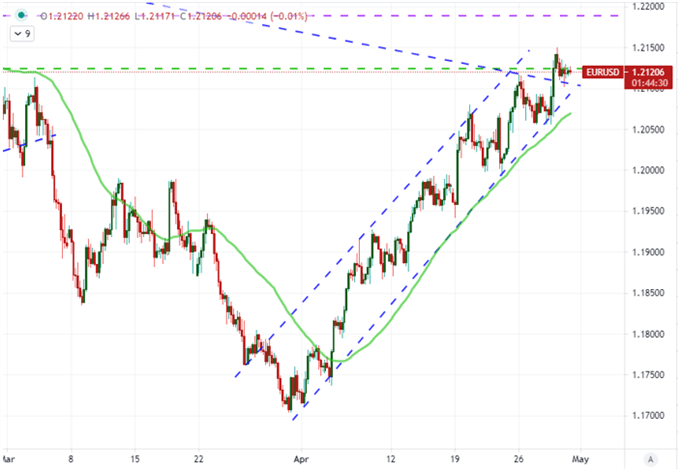
Chart Created on Tradingview Platform
Looking more closely at the Euro crosses given the event risk ahead, there is build up in technical patterns for the likes of EURCHF, EURAUD and EURNZD. I’m also particularly partial to EURGBP where the post-Brexit environment and vaccination rate disparity have turned a bear trend into congestion with a clean technical range resistance at 0.8725. That said, it is frankly impressive to see the progress of EURJPY. Where other explicit carry-supported Yen crosses have struggled to mark fresh highs, this particular cross has seen a closing, rising wedge break in favor of the prevailing bias. That is an encouraging technical signal even if the fundamental don’t fully add up. If the Euro-area economies and ECB seem to have a fire lit under them after Friday’s data, that added foothold could encourage more aggressive efforts.
Chart of EURJPY with 50-Day Moving Average (Daily)
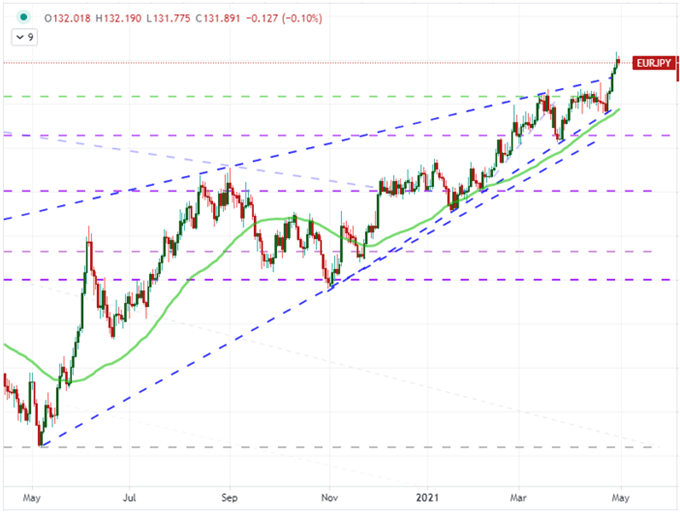
Chart Created on Tradingview Platform

.


