


S&P 500, Earnings, GDP, Bitcoin, Dollar and EURUSD Talking Points:
- Sentiment ended on a positive note this past week, but that didn’t translate into much progress with the S&P 500 holding its smallest range in 15 months
- With the leading favorite speculative vehicle cryptocurrency in retreat, market participants should be on high alert ahead as the docket fills out
- Outside of systemic issues like taxes, regulations and grey swans; the docket holds GDP data, earnings and key monetary policy updates from the Fed and BOJ

Risk Appetite Continues to Point Higher As Shooting Star Falter
Sentiment ended on a updraft to close out this past week with more than a little justification going on. Collective bias often overrides cold hard rationalism in traditional measures of value, and that seem to be the course being followed at present. Through there were a few highlights from the docket through the period we have just closed – including the April PMIs – there was just as much unfactored risk popping up including revived concern of monetary policy normalization and fears of higher taxes for the high-flying capital markets. It will be important to register whether the market will continue to filter for favorable news ahead with such a loaded docket. To be sure, risk trends seem to be awaiting a clear catalyst to resolve indecision around decisive trend. The S&P 500 once again is a good representative of our current condition. It remains on the cusp of fresh record highs and has not broken the general bull trend of the post-pandemic recovery. On the other hand, the past 10-days have carved out the smallest range in 15 months while realized volatility has plumbed similar historical levels. In other words, we await a spark to reignite conviction.

Chart of S&P 500 with 100-Day Mov Avg and 10-Day ATR and Historical Range (Daily)
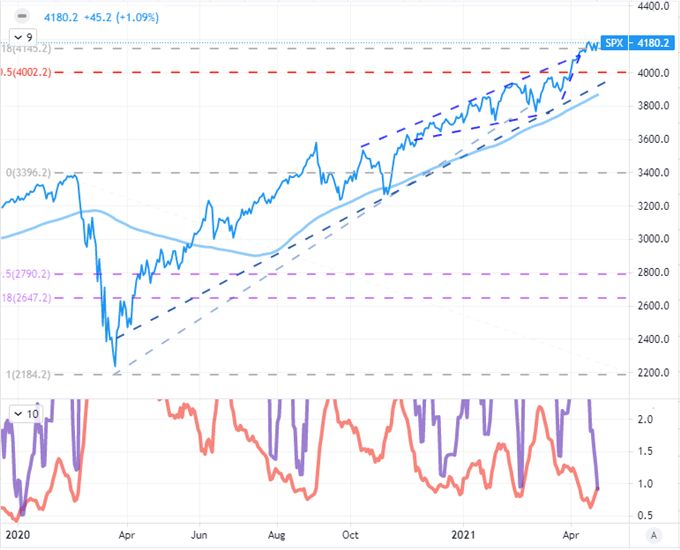
Chart Created on Tradingview Platform
While the US indices tend to draw an inordinate amount of attention from those looking to plot the course of sentiment across the global financial system, that particular group is not exactly at the front lines. We have seen the favorite asset of the most brazen risk takers shift a few times over the past six months, but cryptocurrency seems to have taken the title over since the meme stocks and SPACs faded from the spotlight. If the baton is still being held by this newer category, there is reason for concern. Dogecoin in the four days through Friday dropped more than 60 percent from its highs to the low at the end of the week – where it took 108 days to from the start of the year to gain approximately 9,000 percent (a staggering advance) to this month’s highs. Meanwhile, the more stalwart Bitcoin dropped more than 20 percent from its record highs over the past two weeks as countries crack down on crypto and tax agencies raise the take on this market increasingly encompassed in the category of ‘speculative asset’.
Chart of Bitcoin Overlaid with Dogecoin (Daily)
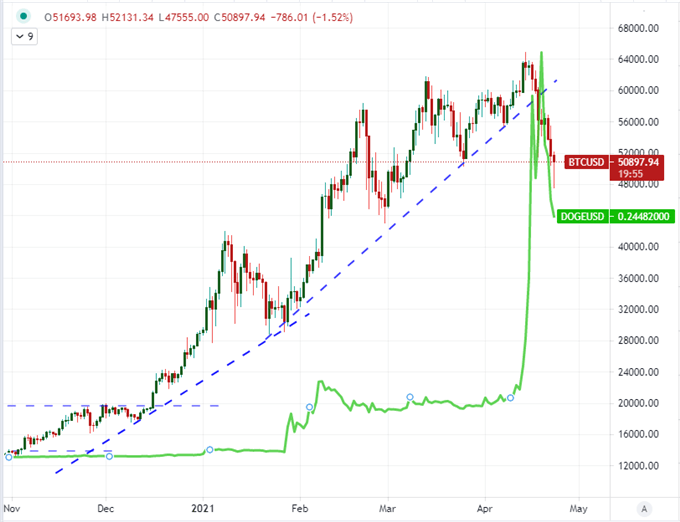
Chart Created on Tradingview Platform
Oh, The Serious Themes to Watch
Looking at the docket for the coming week, there is an inordinate amount of high-profile event risk. That can sometimes work to the detriment of trend formation as the anticipation of the next major release can curb the response to the something that has just crossed the wires. However, such a situation would simply be par for course at present, so the real risk is breaking from that impassivity. Putting aside the abstract matters like policy changes, Covid headlines or other unknowns; the docket holds three general themes that I will be tracking for greater impact than specific assets or even regions. First is earnings. Things get serious for US corporate reporting next week with updates from the likes of Tesla, AMD and Discovery Communications (one of the key Archegos holdings). However, it is the FAANG members which command my attention as the leading group among thematic traders before meme stocks swooped in. If I had to highlight one stock in particular as a representative – which is more likely to be determined by the scale of surprise – it would be Amazon (AMZN) as a representative of both tech and consumption. Read more on what is key in earnings season here.
Chart of Facebook, Amazon, Apple, Netflix and Google Performance from June 1, 2020 (Daily)
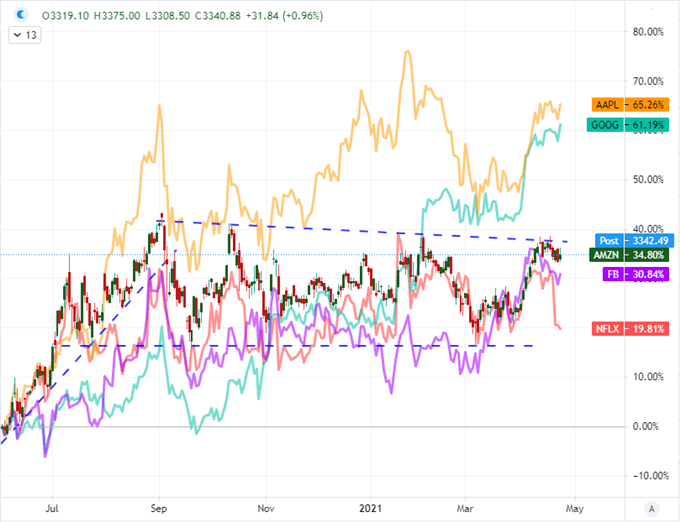
Chart Created on Tradingview Platform
Another theme of some great prominence over the coming week is the update on health from a handful of major economic regions. While South Korea and Mexico 1Q GDP readings are worth watching for the Won and Peso respectively, the top listings in this area are clearly from the US (Thursday) and Euro-area (Friday). The expectations are clearly set and reasonably backed by more timely measures of the monthly variety, so favorable readings would likely just reinforce the expectations already set. Significant disappointments are the scenario which I believe would have the most perceptible impact – particularly given the data comes out late in the week which is a poor time to urge the development of a new trend.
Chart of Major Economies Monthly PMIs as Proxy for GDP (Monthly)
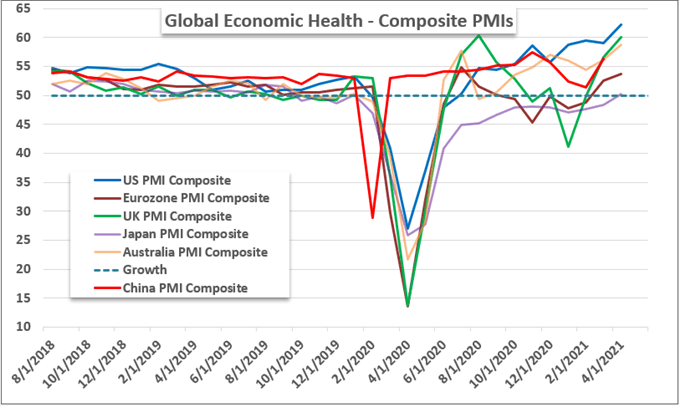
Chart Created by John Kicklighter with Data from Markit
In contrast to GDP figures, the top two central bank events on tap this week come out at favorable times to tap liquidity and play through in liquid markets thereafter. The Bank of Japan (BOJ) meeting will report early Tuesday morning in the Tokyo session but no material change is expected. However, we have seen this most accommodative of policy makers already ease up when it allowed for a wider fluctuation around its 10-year yield target and the change of its asset purchase mix. My real interest is in the Federal Reserve’s (FOMC) policy gathering. Again, nothing is expected here; but the Bank of Canada’s unexpected reduction in asset purchases this past week and recognition that there is a timeline to acclimate the world to an eventual and inventible normalization should keep all gatherings as weapons hot.
Graph of Relative Monetary Policy for Major Central Banks
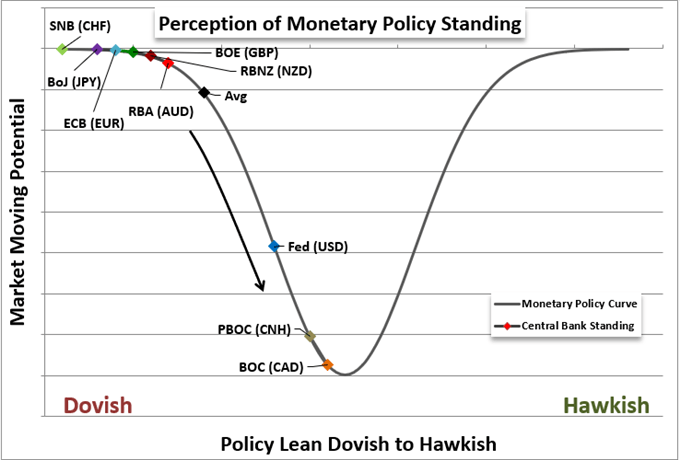
Graph Created by John Kicklighter
The Relative Targets of Volatility
As event risk and volatility plays out over the coming week, my first concern is whether risk trends will be moved to a significant change in tack. It is a low probability given our general state, but it is critical to always keep an active eye on the possibility. Alternatively, relative considerations are generally more ripe for expressing volatility and potentially even trend development. The Dollar will be a focal point for many of the themes to deal with: risk trends, growth forecast, taxes, etc. An extended retreat from the DXY Index has confirmed a clear out of key technical levels. Of course, this is principally a reflection of EURUSD, so consider the picture accordingly. Nevertheless, recent correlations between this Greenback measure and Fed Fund forecasts and risk trends have been remarkably strong.

Chart of DXY Dollar Overlaid with Implied Fed Rates, S&P 500 with Correlations (Daily)
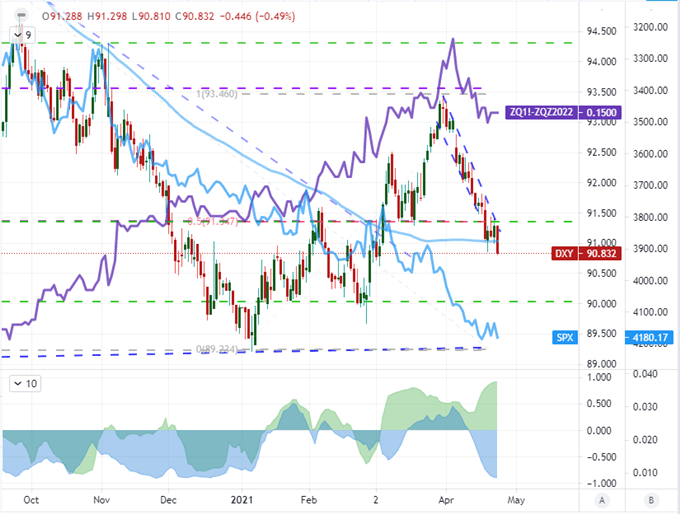
Chart Created on Tradingview Platform
The relative considerations make for some interesting considerations in different pairs. USDJPY is a particularly interesting benchmark cross. There is a risk orientation to the exchange as with most Yen crosses. That said, despite the steady rise in areas like US indices, USDJPY has extended its slide from the late March high. In fact, the pair has dropped for 10 consecutive trading days which is the longest unbroken slide since August 2011 – when the Japanese government was outright intervening on behalf of the Yen. Statistically, this is unlikely to last much longer, but a bullish candle shouldn’t be read as a true turning point.
Chart of USDJPY with Consecutive Candle Count (Daily)
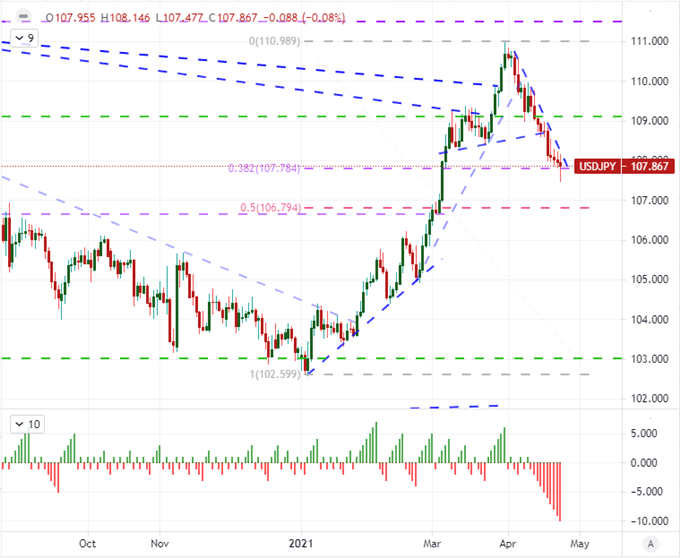
Chart Created on Tradingview Platform
Among other Dollar majors to watch, GBPUSD has appealing technical range features while USDCAD has been thrust back into a more-than-year long bullish trend channel. That said, there is no neglecting EURUSD. With Friday’s additional strength – more Euro than anything else – the cross once again overtook its 100-day moving average. There isn’t much more in the way of technical overhead until we get to 1.2200 or 1.2350. Nonetheless, the weight of this exchange rate is something that should be assessed regardless of its appeal as a principal trading vehicle to a theme.
Chart of EURUSD with 100-Day Moving Average and Net Speculative Futures Positioning (Daily)
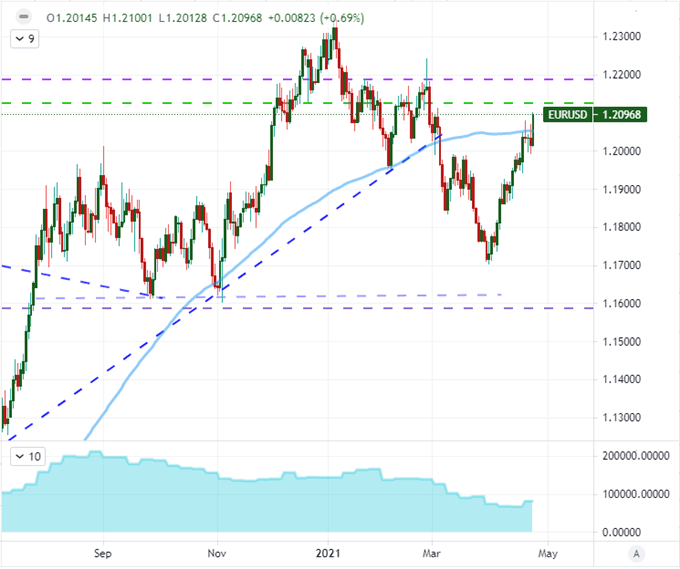
Chart Created on Tradingview Platform

.


