


S&P 500, Nasdaq, USDJPY, GBPUSD and USDCNH Talking Points:
- The S&P 500 and Nasdaq 100 advanced this past session, but risk appetite wasn’t gaining much in the way of systemic traction
- US CPI accelerated faster than expected; but a slip in the Dollar, carry trade, the 10-year Treasury yield and bounce in emerging markets defied expectations
- USDJPY is one of the few pairs staged for various scenarios while US earnings and central bank speakers can direct risk while USDCNH will feel trade war rhetoric

In the Absence of Panic, More Risk On for the Momentum-Fed
There was noteworthy event risk on tap over the past session and the top listing – US CPI – struck one of the market’s more raw nerves from the past few months. Despite the building pressure for the symbolic leader of the world’s massive stimulus effort to start reining in the excess, the markets didn’t seem to register much of the threat. As if a routine, the US indices seemed to carve out another default session of restraint and preference for the pre-established momentum. The S&P 500 traded in less than a 24 point session that pushes the 6-day ATR (a measure of activity over that period) to the lowest levels since the holiday 2019 period.

Chart of S&P 500 with 100-Day Mov Avg and 10-Day ATR (Daily)
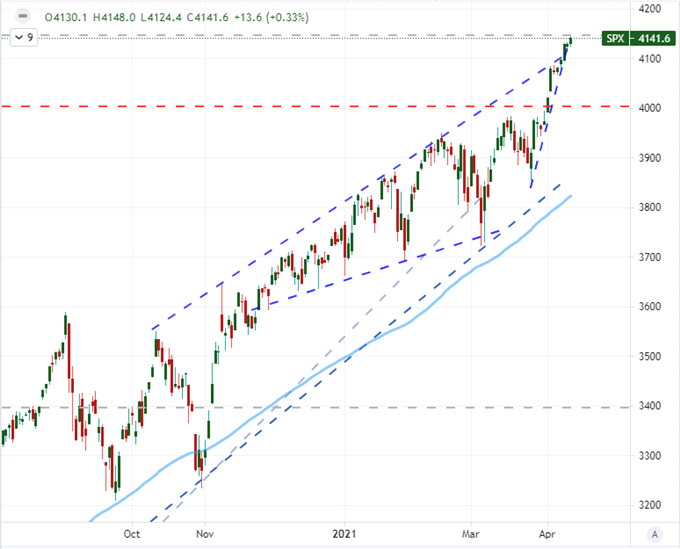
Chart Created on Tradingview Platform
For the other major US indices I typically track, there was a little contrast to draw to the S&P 500 – but not much. The Nasdaq 100 enjoyed the best performance with a 1.2 percent charge that finally cleared the February 12/16 swing high to notch a record. In contrast the Dow Jones Industrial Average slipped modestly for a second day. It seemed the market was ready to chalk up the relative struggle to the news that the CFC and FDA recommended pausing administration of the Johnson & Johnson vaccine to investigate concern over rare symptoms. Fully reopening the economy is an important pillar to current market enthusiasm, but the White House seems confident that this would not delay the timeline for access to all American adults. I similarly believe it had little sway over market mood.
Chart of Nasdaq 100 to S&P 500 Ratiowith 100-Day Moving Average (Daily)
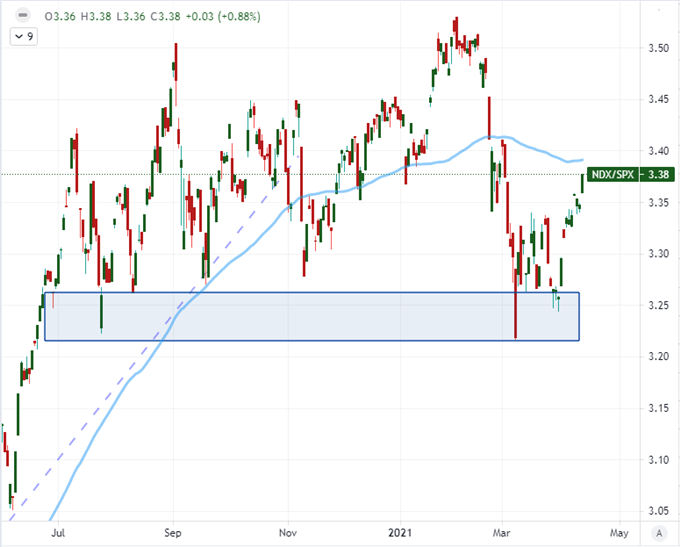
Chart Created on Tradingview Platform
So Does the Market Not Care About Inflation Now?
There have been a number of surveys and polls taken recently measuring investor and economist sentiment over the past weeks and months, and one of the more common themes flagged as a risk has been the fear that the central banks will be forced to withdrawal the support that they have established as bedrock for sky high asset prices. It was therefore surprising to me that the news of a 2.6 percent headline inflation reading – a jump from the 1.7 percent pace the month prior – would not trigger the risk aversion that seemed to be feared. This is not the only inflation figure to reflect pressure. Breakeven inflation rates and expectations from various consumer measures not to mention upstream price measures all show similar. Through this, the Fed message has been the same and it is likely to remain so until they feel backed into a corner. It seems the market may decide to deflate some of its skepticism discount to maintain the convenience of undisturbed – though slow to progress – markets.
Chart of US CPI Year-Over-Year and the 5-Year Breakeven Inflation Rate (Monthly)
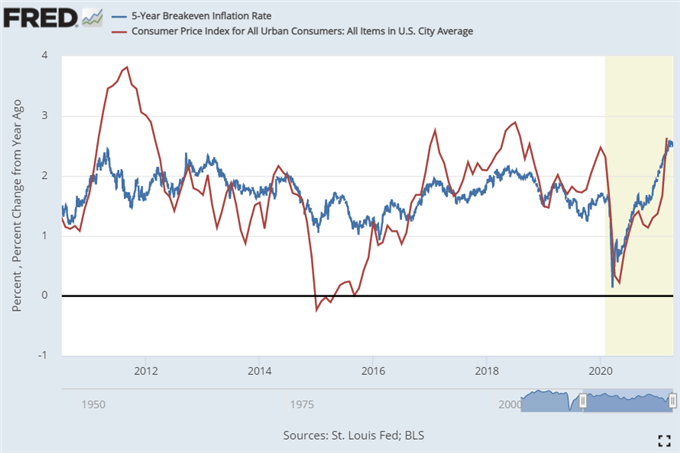
Chart from the St Louis Federal Reserve’s Economic Database
Perhaps even more remarkable than the market’s decision to default to risk on through a fundamental haze was the Dollar’s own slide. The DXY Dollar Index dropped below 92 following the data, but it wasn’t just a Greenback response. Emerging markets which usually show taper tantrum fear earlier than other assets and USDJPY carry trader were similarly easing. Closer to home for the Dollar, the US 10-year Treasury yield dropped 3.2 percent to weigh on the 1.60 level yet again while the implied forecast from Fed Fund futures cut its forecast for tightening through the end of 2022 to 17 basis points (a 68 percent probability of a hike). The tangible factors to the Dollar strain are there. That said, whether the currency is feeling pressure for its haven status or its diminished forward-looking yield advantage, I am not particularly inspired by a strong trend view.

Chart of DXY Dollar and 100-DMA, Overlaid Fed Funds Dec 2022 Forecast (Daily)
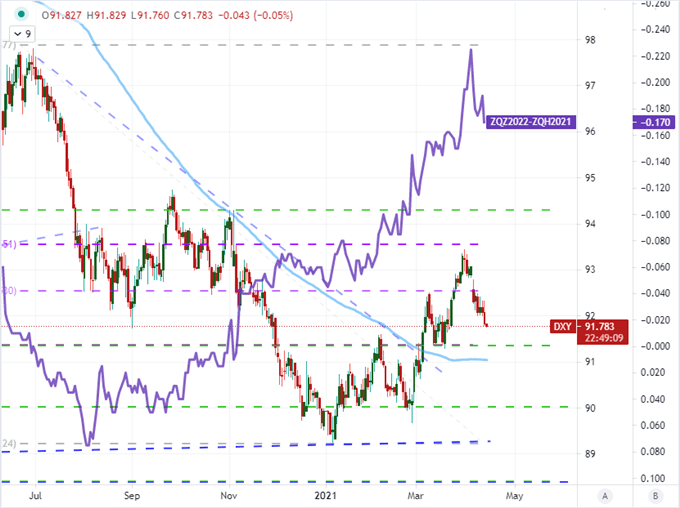
Chart Created on Tradingview Platform
Considering my view of the Greenback, it can be difficult to find pairs that meeting the combination of market conditions, technicals and controversial fundamentals. EURUSD is the biggest representative of the index but it doesn’t have much in the way of meaningful technical milestones of its own. AUDUSD and NZDUSD are trading ranges that are far too tight over the past two weeks or so, but the bearing doesn’t align to the technical picture which is large head-and-shoulders patterns which would best catalyze in motivated bearish scenarios. USDJPY on the other hand was one of my favorite pairs for the quarter. The break above 109.50 and 110 doesn’t seem to have fully flipped gravity. In fact, it looks more like a false break on a multi-year wedge and subsequent reversal. Pushing back below 109 is still difficult to abide in a trend perspective, but it can find traction whether we see the Dollar continue its retreat or in the event that risk aversion swoops in.

Chart of USDJPY with 20-Day Moving Average (Daily)
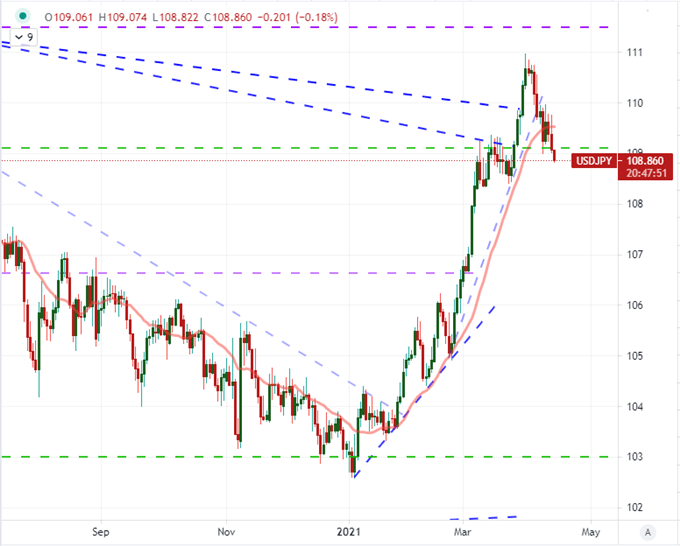
Chart Created on Tradingview Platform
Top Event Risk for Wednesday
As Wednesday trade gets underway, the attention shifts to different fundamental priorities. Off docket, I’m keeping tabs on the headlines around skepticism building around points that speculative excess. The news this past session of Asia-based Grab setting a SPAC record that pushes its valuation to $40 billion is starting to push conservative market observers off the deep end. This should also generate even more interest in the traditional IPOed Coinbase which will be the first crypto exchange to trade through traditional shares markets. On the docket, the most prominent fundamental wave will be from the start of the US earnings season in earnest. As usual, the banks will be front and center in the first week with Goldman Sachs, JPMorgan and Wells Fargo revenues reflecting rising yields, fallout from Archegos and the economy reopening. I will however keep a close eye on Bed Bath and Beyond given its role in the Reddit board run short squeeze of January.
Chart of Six Month Performance for Wells Fargo, Goldman Sachs, JPMorgan, Dow, BBB (Daily)
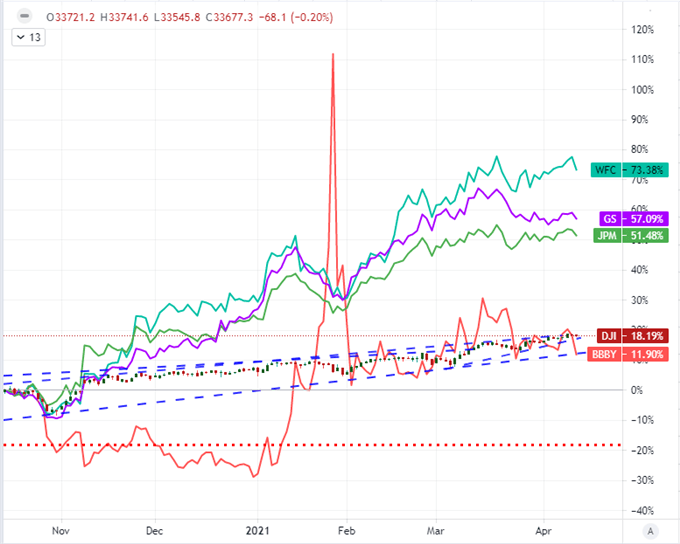
Chart Created on Tradingview Platform
Another theme that I keep coming back to but which doesn’t have much mainstream interest yet is the US-China relationship. On tap later today is the Senate Foreign Relations Committee meeting scheduled to discuss how the US government will deal with the world’s second largest economy as the two compete for economic supremacy and influence – not to mention disputed human rights and territorial issues. Neither side seems to be willing to back down from its stance and economic engagement seems the preferred route to exert pressure. As such, USDCNH as a tool to divert some of the pressure on China’s part is something for which it is important to keep close track.
Chart of USDCNH with 20 and 100 DMA (Daily)
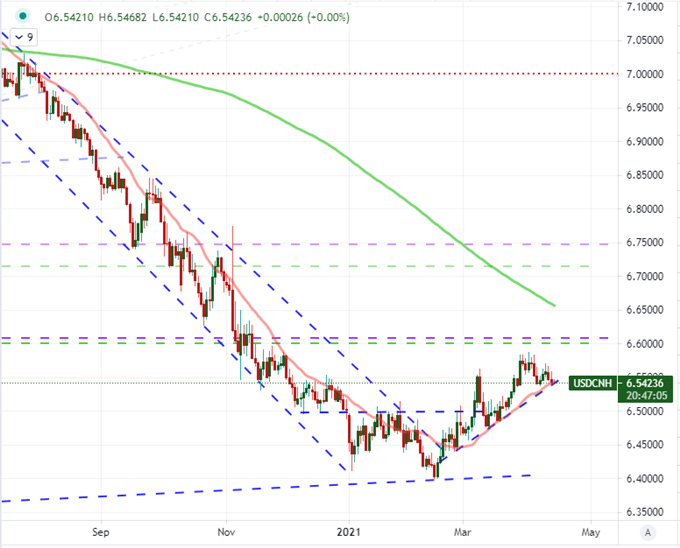
Chart Created on Tradingview Platform

.


