


S&P 500, US 10 Year Treasury Yields, EURUSD and AUDUSD Talking Points:
- While the S&P 500 may still be flirting with support that stretches back to the post-Pandemic recovery, most risk assets were notably under pressure this past week
- There is a range of high profile event risk this week and even a few themes (GDP, US stimulus, vaccination rates), but risk recognition against yields seems a top focus
- In addition to US indices, the Dollar will be scrutinized under risk trends and data like NFPs while AUDUSD may be top volatility listing with AU GDP and the RBA

A Precarious Way to End the Week for Risk Appetite
While the markets managed to avoid the most overt signs of capitulation from the stretched measures of speculative appetite to close this past week, we seem dangerously close to the edge heading into the new trading week. There remain a host of fundamental threads that could support bulls looking for reassurance such as the expected House vote on Biden’s $1.9 trillion stimulus program or the distribution of Covid vaccinations moving us closer to normalcy. However, those matters are not guaranteed to distract the speculative rank from the doubt that is starting to eat its way into confidence. While inflation and interest rates is a top talking point, it is really the recognition of dependency on external support structures that is posing the true threat to stability ahead. This can be a difficult and otherwise abstract theme to track, so a representation from the likes of the S&P 500 set to start the new week on the edge of support stretching back to the start of the post-Pandemic recovery can be a helpful indicator.
Chart of S&P 500 with 50-Day Mov Avg and 1-Day Rate of Change (Daily)
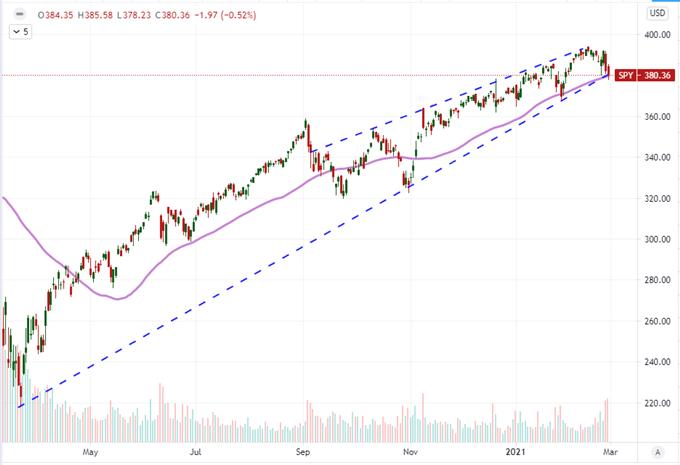
Chart Created on Tradingview Platform
When we are looking for the possible motivations of systemic trends, it is important to establish what is motivating a sea change – especially if we are looking to confirm the reversal of a near 12-month bull trend – but it is just as critical to watch price action itself. While I appreciate the convenience of tracking single measures of sentiment like a major US index, my preferred measure of ‘risk on / risk off’ is the course and correlation of a range of liquid speculative assets. While the S&P 500 and Nasdaq 100 held their respective lines through the week’s end, measures like the EEM emerging market ETF, HYG junk bond index and AUDJPY carry trade all registered meaningful, if tentative, breaks. If selling pressure picks up after the weekend with a high degree of correlation, something more seismic is likely afoot.
Chart of Rolling 12-Month Performance for ‘Risk’ Sensitive Assets
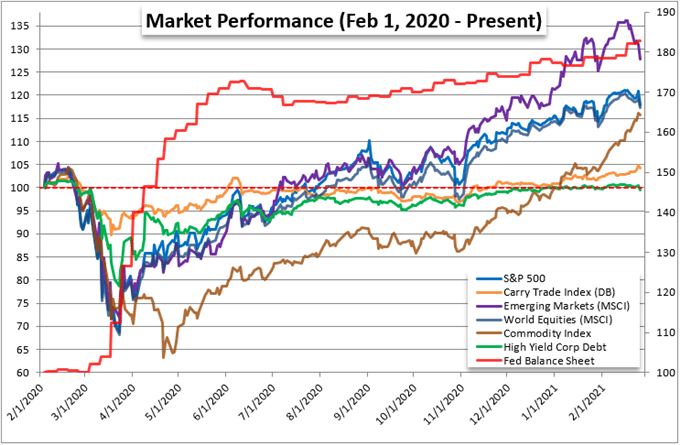
Chart Made by John Kicklighter
The Top Fundamental Theme: It Looks Like Inflations but Its More Entrenched
Looking for fundamental guidelines through the coming week, there is no shortage of scheduled event risk or even general theme. For pure data, we have Chinese PMIs to start the week and US February NFPs to end it. Those are good sparks but struggle to catalyze to full play momentum. The expectations around the US stimulus program (with plenty of room for disappointment if it is reduced or falls apart) and vaccination distribution are expected to be regular fodder. However, this past week’s headlines were topped by concern over central bank ‘tapering’ so it stands to reason that remains to focal point next week. The probability that the Federal Reserve and other major central banks reduces its support in the near future is very low; but then again, the last taper tantrum hit in early 2013 when the Fed didn’t actually reduce its balance sheet until 2015.
Chart of Global Google Search for ‘Taper Tantrum’ (Weekly)
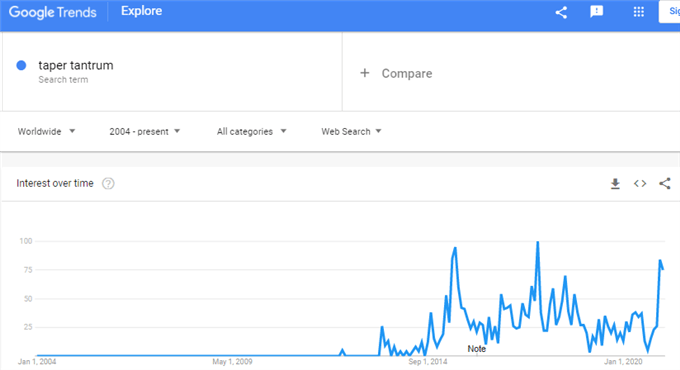
Chart Created by John Kicklighter with Data from Google Trends
While the Fed and international counterparts regularly assure the markets that they have no intention to tighten the reigns and risk the post-shutdown recovery, the markets doesn’t often go on policy officials’ word. This past Friday, the Fed’s favorite inflation indicator, the PCE deflator, printed well below the 2 percent official target; but inflation expectations continues to ride significantly higher according to the five-year breakeven inflation rate. Markets are forward looking and notoriously skeptical of the central bank’s (and other institutions’) efficacy. Furthermore, the traditional fundamentals have played far less of a role of the market’s climb this past year/s than sheer sentiment; so why wouldn’t that same skew hold on a reversal?
Chart of US 5-Year Breakeven Rate and PCE Deflator Year-Over-Year (Monthly)
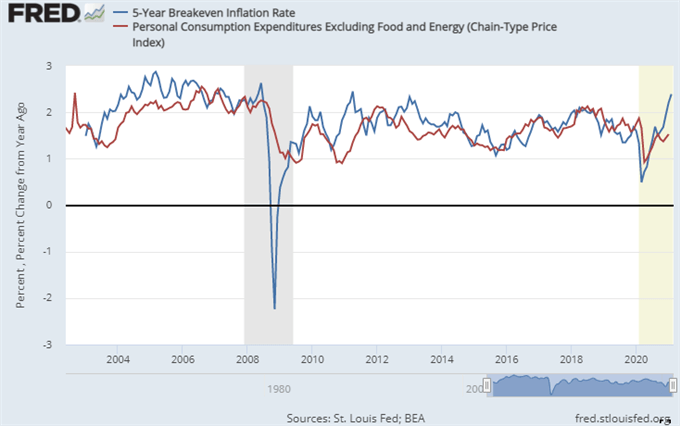
Chart from St. Louis Federal Reserve Economic Database
For those whose eyes glaze over when the conversation shifts to inflation and the program mix of major central banks, there seems to be a fairly straight forward measure of pressure in these market: Treasury yields. The US 10-year yield peeled back Friday, but it is still up significantly over the past month. Further, differentials like the 10-year to 2-year spread indicate funding issues that may be more rudimentary than systemic speculation in nature. What’s more, rates are not just a matter for the US. We have seen European (German, French, Eurozone, etc), Japanese, Australian and other major countries’ benchmark yields soar this past week in particular. If the pressure is global, it is a greater risk of destabilization.
Chart of US 10-Year Treasury Yield with 50-SMA and Aggregate 10-Year Yield (Daily)
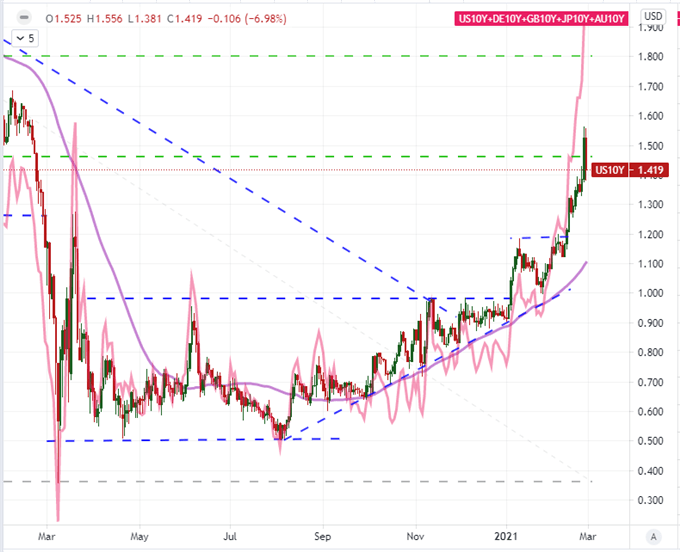
Chart Created on Tradingview Platform
FX Pairs That Will Stand at the Center of Targeted Event Risk
While we are wading into to some potentially turbulent fundamental waters, that is no guarantee that the speculative fervor will sweep the market up. I will be watching the overt themes to see if they escalate while also monitoring the convenient release of high-level event risk through the week for bouts of potential volatility. The greatest potential of movement comes when those two worlds collide. EURUSD holds that capacity. The benchmark FX cross suffered its biggest single-day drop since April 2nd Friday amid the retreat in US yields and calls from an ECB official for ramping up Eurozone bond purchases to halt a rise in their own debt market. Ahead, Eurozone docket items of merit are few – such as Eurozone employment and retail sales – while the US calendar is more onerous. The ISM manufacturing and service sector activity reports are perhaps more indicative of the country’s growth, but NFPs gets more newsprint.
Chart of EURUSD with 100-Day Moving Average and 1-Day Rate of Change (Daily)
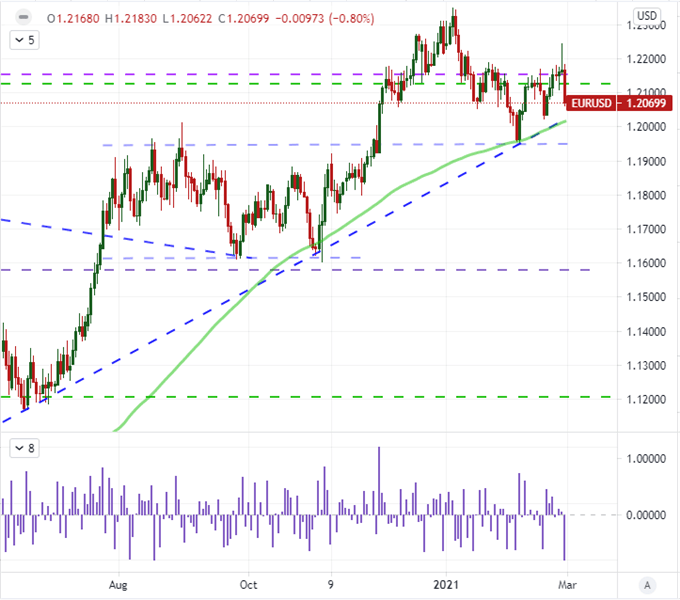
Chart Created on Tradingview Platform
For sheer scale of high-profile event risk, there is no more beset pair than AUDUSD. The US side of the equation is similar to the issues listed previously, but here it takes on more of a potential safe haven role. On the other side of the hash, the Aussie docket offers up both 4Q GDP and the RBA rate decision. On Friday morning, the Australian monetary policy authority issued an unscheduled offer to purchase up to A$3 billion in three-year government bonds as the tenor’s yield above its 0.1 percent target. That does not bode well for a carry currency where the status quo could unintentionally foster speculation of an eventual rate hike for the yield hungry. Surprise actions to the opposite effect cut into considerable premium – as seen with the pair’s biggest single-day drop since March 18th.
Chart of AUDUSD with 100-Day Moving Average (Daily)
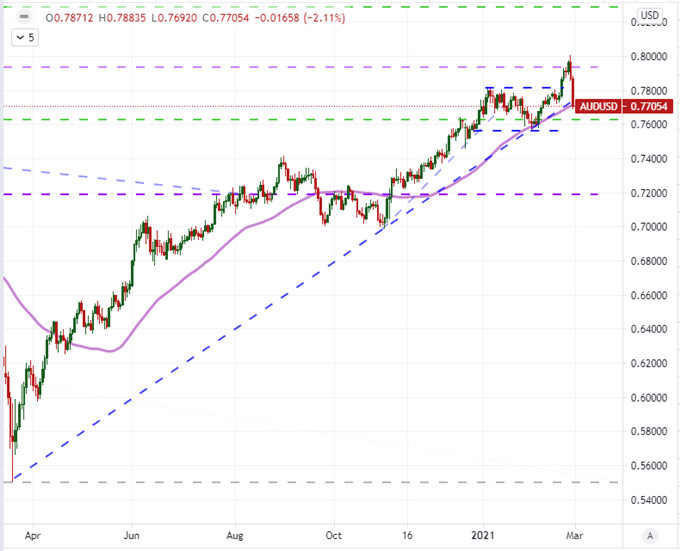
Chart Created on Tradingview Platform

.


