


S&P 500, GameStop, US 10 Year Treasury Yields, Inflation Talking Points:
- A brief rebound in risk trends was cut ruthlessly short this past session to the tune of a -2.5% S&P 500 drop and -3.6% Nasdaq 100 tumble
- What stages a greater risk for Friday is the breadth of the risk aversion paired with the acute intensity
- Retail efforts to boost GameStop and Bitcoin are now being overshadowed by rising yields and taper tantrums…old guard matters

Another Sharp Reversal in Risk Trends, Will This One Stick?
We have witnessed a few different switchbacks in risk trends over the past few weeks, but the reversals have yet to usher in a truly productive trend. In a competition between retail speculation that casts aside traditional fundamentals and the crush of reality in real returns for professional traders, there remains volatility without commitment. Is this most recent U-turn a different story? Through the New York session Thursday, there was an unmistakable slump in risk trends. The swoon was most readily registered through the likes of the S&P 500 which dropped -2.5 percent back to the combo of its 50-day moving average and the trendline support that stretches back to the reversal low post-Pandemic (last March). At roughly 3,800 for a contested floor, the technical traders will be watching closely. Yet, if we are going to pitch into a true break and subsequent trend, market conditions that reflect high correlation, intensity and persistency in ‘risk aversion’ would be the most convincing backdrop. The potential is there, but the wheels are not yet turning.
Chart of S&P 500 with 50-Day Mov Avg and 1-Day Rate of Change (Daily)
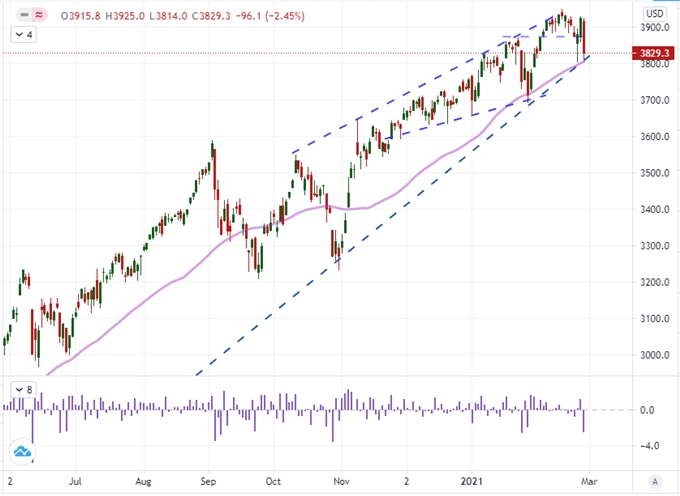
Chart Created on Tradingview Platform
In my book, perhaps the most effective driver of a trend in the deeper waters of the financial system is a definitive drive around the need to broadly build of speculative exposure or otherwise unwind. Through this past session, there was a marked intensity to the risk aversion from the US indices, emerging market assets and commodities among others. That combination of intensity paired with an alignment in course from otherwise unrelated assets settles to an list of very few possible influences. I do think Thursday’s slump was a sign of risk aversion, but the urge to a true bear trend still has hurdles to clear – most immediately is short-term follow through.
Risk On / Risk Off Spectrum
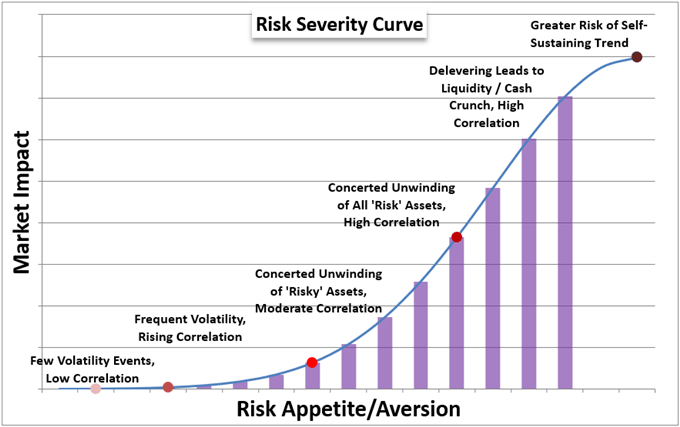
Chart Made by John Kicklighter
While I frequently reference the US indices – recently the S&P 500, Nasdaq 100 or Russell 2000 depending on the circumstances – as a preference but imperfect one-look gauge of sentiment; it is the correlation across unrelated assets that really speaks to intent. Through this past session, there was an unmistakable slide in a variety of markets through the New York trading session specifically. In addition to the indices, the EEM emerging market ETF drop -2.3 percent, copper fell -1.2 percent and the HYG junk bond index fell -1.0 percent. If this pressure carries through Asian and European sessions before bears pick it back up into the US session, I will worry more of a cliff edge close into the weekend.
Chart of Rolling 12-Month Performance for ‘Risk’ Sensitive Assets
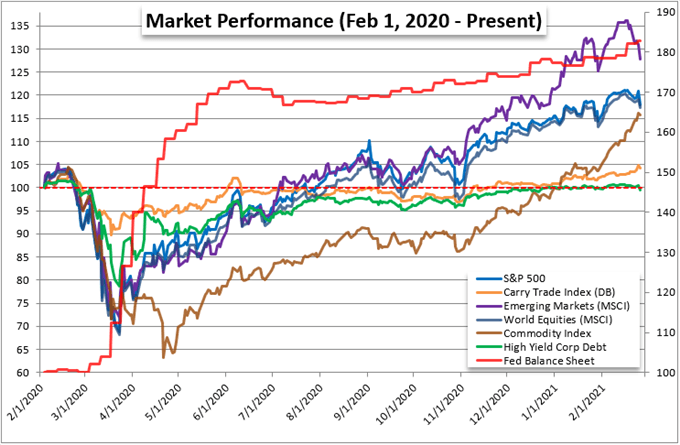
Chart Made by John Kicklighter
‘Disruptors’ Can Do Little Against a Tidal Wave
Over the past few months, a lot of influence has been accredited to the collective interests of the retail trader. To be sure, there has been an impressive drive for the likes of GameStop, AMC and Dogecoin. Yet, for all of the intensity of these moves, they have ultimately settled at more sane levels and volume. It is easy to ascribe some supernatural potential to assets that exhibit extraordinary volatility, but that is a function of liquidity. The smaller the market, the more dramatic a targeted move by a coordinated group can prove. Yet, the ends for such a move are not a change in the order of influence but pure appetite for quick profit. That is likely why the recent GameStop resurgence immediately fell on hard times after Wednesday’s surge (during active trade and after hours). What’s more, the performance of these small assets is very unlikely to scale up to a global market influence.
Chart of GameStop with 50-Day Moving Average (Daily)
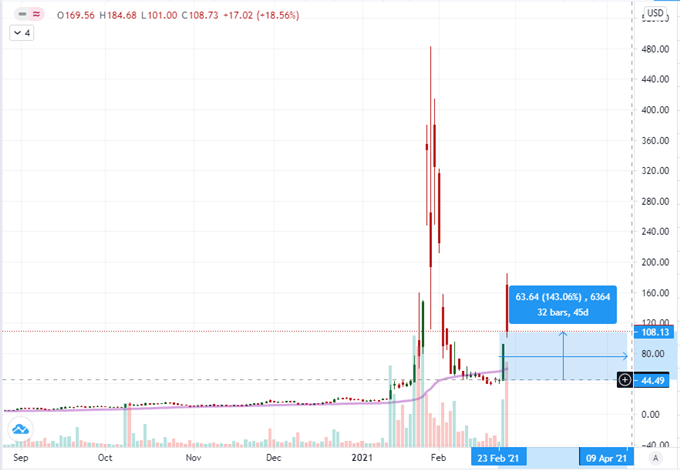
Chart Created on Tradingview Platform
As a reminder, there is a very distinct contrast in the picture being cast for market sentiment in both the performance of different asset classes but also the concerns highlighted across the globe. ‘Day trading’ is proliferating while the ‘buy the dip’ mentality has strengthened with new variants in ‘diamond hands’ (meme stocks) and ‘laser eyes’ (Bitcoin) memes. Yet, these social calls to action cannot override any serious needs to withdrawal exposure should they arise. And, the recognition of ‘market bubble’ conditions is at its highest in nearly 15 years.
Read about how the rise retail can be a signal for a market mania.
Chart of Global Google Search for ‘Market Bubble’ and ‘Buy the Dip’ (Weekly)
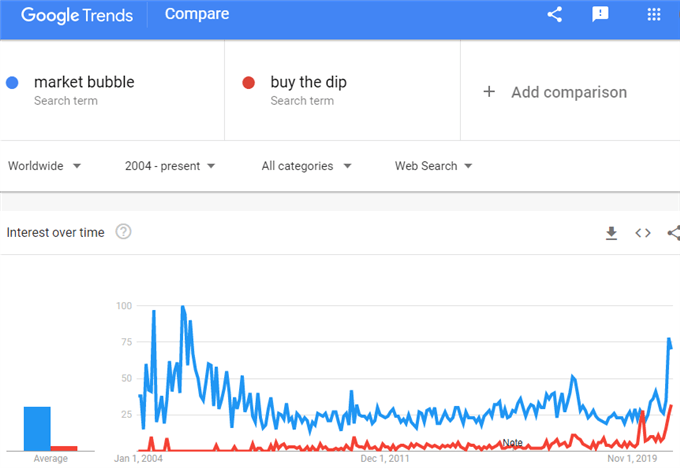
Chart Created by John Kicklighter with Data from Google Trends
What to Watch Ahead: Risk Trends and Inflation
The volatility of this past session has shifted my focus for what can reasonably drive the markets through the final trading day of the week. If not for the intense risk aversion, I would have monitored headlines around the expected vote in the House of Representatives on the proposed $1.9 trillion stimulus program from the Biden Administration. I will still watch for any progress here, but recognition that there are more hoops to jump through and market pricing likely stretches beyond this program means it was more likely to disappoint for full market impact. On the other hand, the otherwise innocuous US PCE deflator for January is likely to take on a greater prominence and therefore potential to move the S&P 500, gold and US Dollar.
Global Macro Economic Calendar
Calendar Made by John Kicklighter
We have been tracking the incredible rise of US Treasury yields over the past few weeks, but the pace increased notably this past session. With the two-day Powell testimony passed without a clear relief from inflation – and thereby taper – fears, we have witnessed a charge above the 1.50 percent mark for the 10-year tenor. What does this mean? Despite the vows from the US central bank, rates continue to rise in defiance of the commitment to keep pressure contained on lending to fuel the economic recovery. Historically, ‘taper tantrums’ have lead to a swell in yields which can threaten risk trends; but it is worth pointing out that the 2013 affair didn’t undermine traditional risk assets. We are much higher now and fully depending on external support however. What’s more, the rise in yields is not just a US phenomenon. Rates are rising globally which carries the risk of triggering risk aversion across the globe.
Chart of US 10-Year Treasury Yield with 50-SMA and 1-Day ROC with Aggregate 10-Year Yield (Daily)
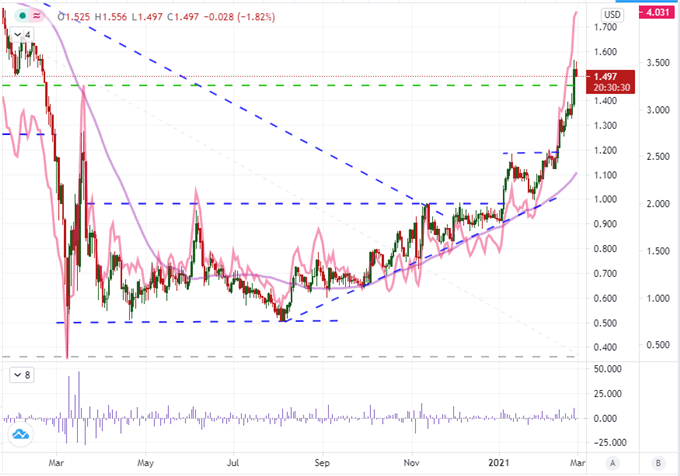
Chart Created on Tradingview Platform
First and foremost, my attention is on the health of risk trends globally. That means that I will be watching the major US indices from Asia into Europe and back into the US session to close out the week. A lull from New York close to New York open is possible, but the most practical scenario for full sentiment collapse would involve a global capsize. While my focus will be transfixed on more intensive risk assets, I will also be keeping close tabs on the performance of the US Dollar. In recent history, more stimulus has registered as a boon for a local currency – most notably lifting the Euro back in July/August. I believe that relationship has flipped back to a ‘traditional’ alignment though, and EURUSD makes for a good barometer to test that relationship.
Chart of EURUSD with 100-Day Moving Average (Daily)
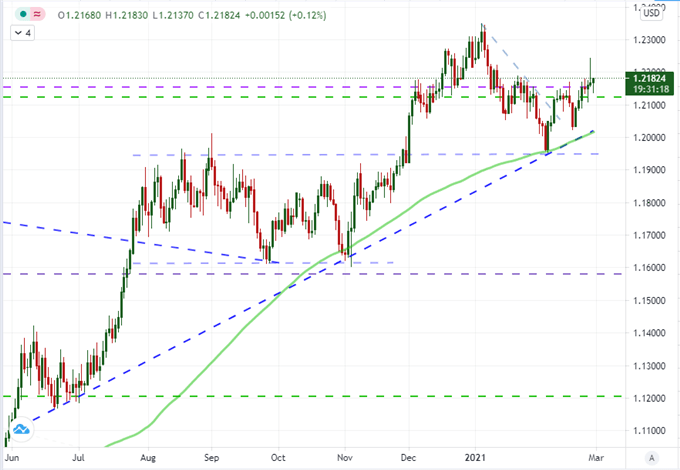
Chart Created on Tradingview Platform

.


