


Russell 2000, S&P 500, EURUSD, GBPUSD, Bitcoin Talking Points:
- Risk appetite continues to progress unevenly at such stretched levels, but the Russell 2000’s highs suggest a lasting skew brought on by the likes of GameStop
- The Dollar has struggled for traction even after a suggestion of a fast tracked US stimulus, leaving pairs like EURUSD in technical limbo
- Bitcoin was Monday’s big mover on reports that Tesla founder Elon Musk purchased $1.5 billion in the cryptocurrency and was considering accepting it as payment for his products

Risk Appetite Continues in More Conventional Channels
The new trading week has kicked off with another favorable bout of risk appetite, but not through the atypical outlets that seemed to dominate the headlines the previous few weeks. Record highs were notched with familiar benchmarks like the S&P 500 and other US indices rather than the very concentrated measures like GameStop, AMC and other ‘fad trades’. That is certainly a picture more indicative of global risk appetite, but it doesn’t necessarily secure a self-sustaining climb by virtue of its existence. If technicals alone were all that mattered when it came to rousing conviction, we could very well have entered the cycle of speculative escalation. That said, the conviction at such rich valuations seems to slowly shift its motivations back to textbook measures like yield and earnings. Perhaps stimulus progress or the pace of vaccinations will keep things moving along – that is what watchers seemed to disproportionately attribute the past session’s performance to according to my headline count. Yet, that seems an unreliable justification-after-the-fact.
Chart of S&P 500 with 100-Day Moving Average and Consecutive Candles (Daily)
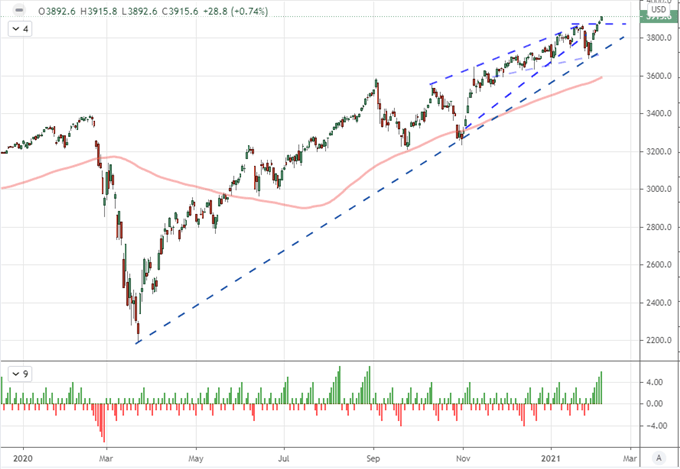
Chart Created on Tradingview Platform
One interesting highlight in the performance of risk assets this past session is a holdover of the speculative appetite for specific small cap stocks that made the ‘top short’ list through the second half of January. However, the bid wasn’t isolated to the likes of Gamestop and its compatriots but rather it would disperse to the smaller stocks more broadly. The Russell 2000 index joined the likes of the Dow and the other US indices by posted a record high. However, the sixth consecutive advance for RUT outpaced the likes of the Nasdaq 100 – the previous period’s high-water mark for risk trends via FAANG members – to trade on the threshold of an 11 month high for the ratio.
Read about how the rise retail can be a signal for a market mania.
Chart of Russell 200-to-Nasdaq 100 Ratio with 100-Day Moving Average and Consec Candles (Daily)
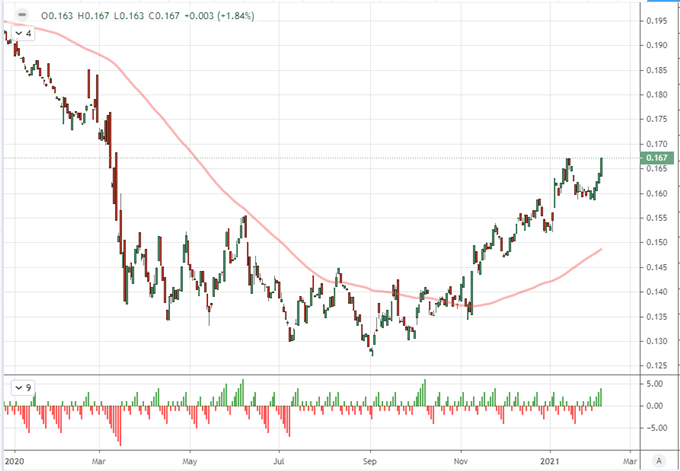
Chart Created on Tradingview Platform
A further dissemination in risk trends could be seen in measures from global equities to emerging markets to carry trade. The most impressive showing in my book, however, was registered by those measures that combined both speculative appetite and growth implications. Crude oil futures took up the cause with a its own six-day rally that pushed the commodity to its highest levels in 13 months. It has been a long climb back from the extraordinary period which dragged oil into negative territory back in April, but now the real technical barriers are coming into view. Long-term, multi-year trendlines are standing above to complicate the natural technical recovery effort. How strong is the charge? Perhaps there is more strength to be found in growth forecasting with the United States moving towards a major stimulus program.
Chart of US Crude Oil Futures with 100-Day Moving Average and Consecutive Candles (Daily)
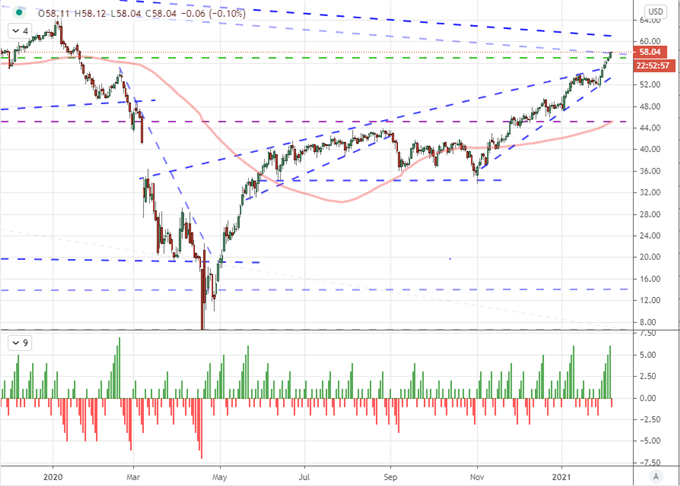
Chart Created on Tradingview Platform
Talk of Stimulus and Talk of Inflation
At the end of last week, US officials in Congress pushed through a budget outline approval which could progress the massive stimulus program through without requiring Republican support. That doesn’t make the Biden administration’s $1.9 trillion effort a certainty, but it I smore than enough to rouse hope/expectation. It was also worth noting that Treasury Secretary Janet Yellen had also stated in an interview on Sunday that the same program being debated could return the US to full employment by 2022. Naturally, this effort to charge growth has some sort of cost; which many believe inflation will be an unwanted side effect. Yellen played down such concerns, but I would point out that we may already be seeing such pressure unfolding in asset prices. The question is whether officials would act to curb that kind of artificial charge?
US Year-Over-Year Rate of Change in CPI and Wilshire 5000 Index (Monthly)
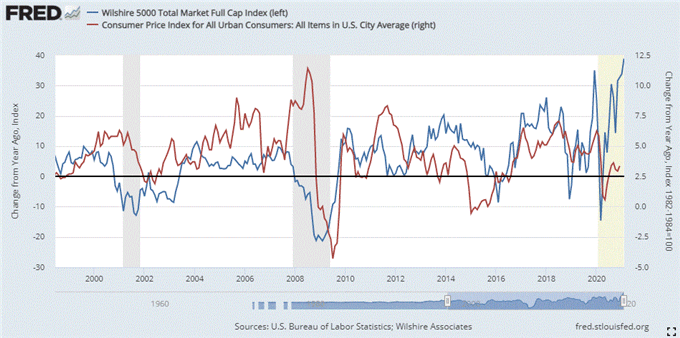
Chart Created on Federal Reserve Economic Database
Notably, the expectations for stimulus to build a cushion for faster growth in the US economy hasn’t led to a relative advantage for the US markets versus the rest of the world – at least not according to the US Dollar. On the cusp of mounting a significant reversal into recovery, the Greenback was cut down last week shy of its 100-day moving average around 91.85 on the DXY Index and has since settled back to trade without a more confounding range. That translates to EURUSD directly. The benchmark exchange rate is now spanning the 1.2065 – 1.1965 range which represents the staged technical boundaries of a Fibonacci retracement span, previous head-and-shoulders neckline, former technical levels and the 100-day moving average.
| Change in | Longs | Shorts | OI |
| Daily | -17% | 6% | -7% |
| Weekly | -22% | 17% | -8% |
Chart of EURUSD with 100-Day Moving Average (Daily)
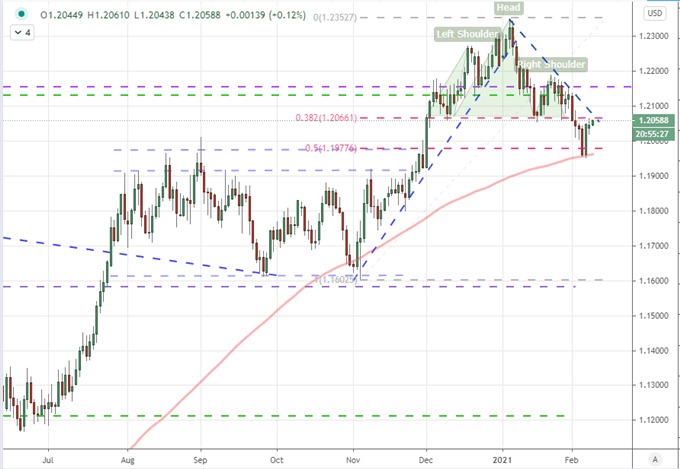
Chart Created on Tradingview Platform
Given the density of boundaries to track out on EURUSD, it is perhaps understandable that the market is not willing to simply given way to a clear bullish or bearish charge for the US Dollar. However, this reticence to accept a clear bearing will not last forever. Eventually, the markets will be urged to a particular bearing – and likely more readily than with an ambiguous measure like risk trends considering relative value has a tendency to find self-leveling benchmarks. There is breakout potential in the likes of AUDUSD and NZUDSD or more ‘productive’ patterns for the likes of USDCAD and NZDUSD. Yet, GBPUSD seems to hold the title for most pressurized pairing among the majors. The 60-day historical range for the Cable is the most restrictive seen in 11 months before the pandemic hit. A break is likely looking further out and this isn’t a pair prone an easy ‘risk’ response.
Chart of GBPUSD with 100-Day Moving Average and 60-Day Historical Range (Daily)
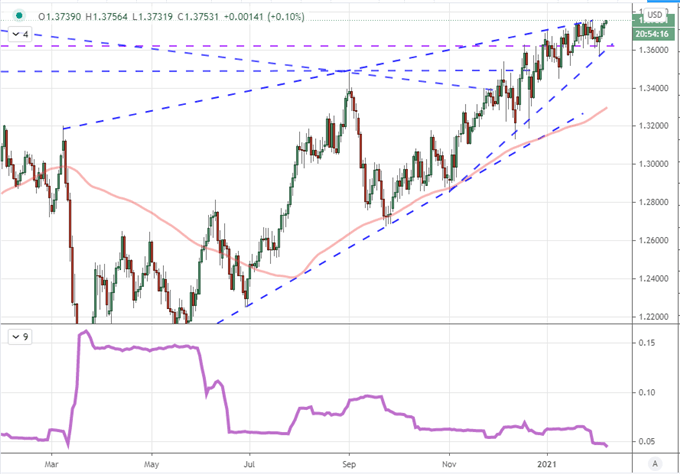
Chart Created on Tradingview Platform
Elon Musk Finds Yet Another Way to Leverage Tesla and Cryptocurrency
Finally, for the title of top market mover, there was once again clear outperformance registered by perennial cryptocurrency favorite, Bitcoin. The largest single-day rally since December 2017 – around the previous peak for the alternative to traditional fiat – was clearly motivated by an outside factor. Proving an unrelenting disruptor, Tesla founder Elon Musk shook the market when it was reported that his company had purchased $1.5 billion in the leading crypto and was expecting to soon accept BTC as payment method for the company’s goods. I see that as a remarkably deft move by Musk that further legitimizes both his own company’s place as a disruptor and the leading blockchain as a financial disruptor by drawing the two together for greater effect than either may have been able to achieve individual. That doesn’t ensure Bitcoin’s overtaking traditional fiat or the appeal of other coins like Etherium or his frequent mentions of Dogecoin, but it does maintain a remarkable relevance.
Chart of Bitcoin with 100-Day Moving Average and 1-Day Rate of Change (Daily)
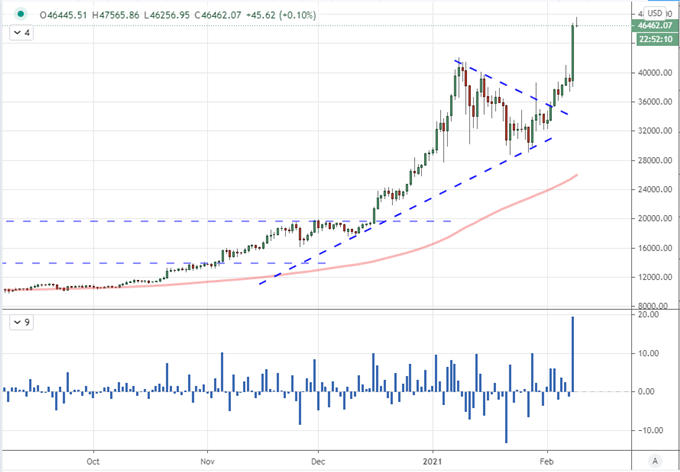
Chart Created on Tradingview Platform

.


