
Nasdaq, GameStop, EURUSD and GBPUSD Talking Points:
- GameStop, AMC and other targets for the Reddit wave looking to punish short-selling hedge funds are seeing both their volatility and volume fade
- While still very possible to experience a second wave of speculative drive, it may be difficult to rouse conviction and funds to motivate this targeted group
- Meanwhile, general risk trends remain as noncommittal as ever and Dollar-based majors like EURUSD and GBPUSD look for cues to run on technical breaks

Has the Reddit-Driven Vigilante Age Already Ended?
While there remain many voices calling to ‘hold the line’ among the groups behind the epic rise in heavily shorted US stocks these past few weeks, it is growing increasingly difficult to ignore the fact that these tickers are leveling out after being significantly deflated. There was a story of unexpected camaraderie and power over market titans that spoke to the average retail trader, but the dynamics behind the move would always be fraught. This is not because the hedge funds with which the collective were competing were better capitalized, but rather owing to the practicalities involved. Retail traders – even those spurred by a desire to correct perceived injustices – are still motivated by a profit and have a far shorter trade time frame compared to professional market participants. That said, expecting a plateau for GameStop or AMC (much less Silver and Ripple) was impractical. Further, a commitment to hold positions deeply underwater until the next wave higher does not fit the profile. It is certainly possible that the pull back we have seen this week is a build up for another leg higher, but that seems an improbable scenario. I will be watching rudimental volatility (short-term ATR) and volume figures on these key players moving forward to register any new groundswells…or to eventually call the end of the era.
Read about how the rise retail can be a signal for a market mania.
Chart of GameStop with Volume and 3-Day Rate of Change (Daily)
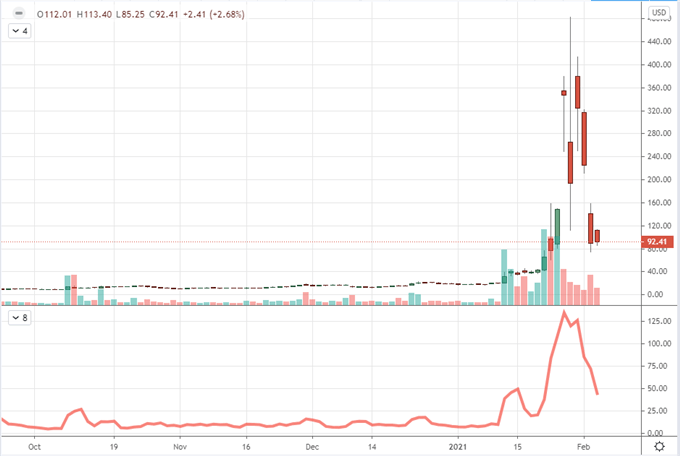
Chart Created on Tradingview Platform
Meanwhile, as macro traders walk on eggshells around names that would have otherwise never registered on the radar, some of the top market cap stocks were testing the waters with normal fundamental provocation. Both Amazon and Google were looking to play out incredible earnings beats that came after the close on Tuesday – $14.09 EPS (earnings per share) versus $7.34 expected and $22.30 versus $15.58 respectively – but the landslide didn’t seem to play out as expected. GOOG realized its afterhours gap Wednesday but it didn’t extend any further progress. Amazon would actually slump. That fits the general tone for the other FAANG members this past session. If these massive market cap, anti-pandemic plays are struggling; it bodes poorly for the rest of the market.
Chart of Google Overlaid with a FAANG Index, Volume and Gaps (Daily)
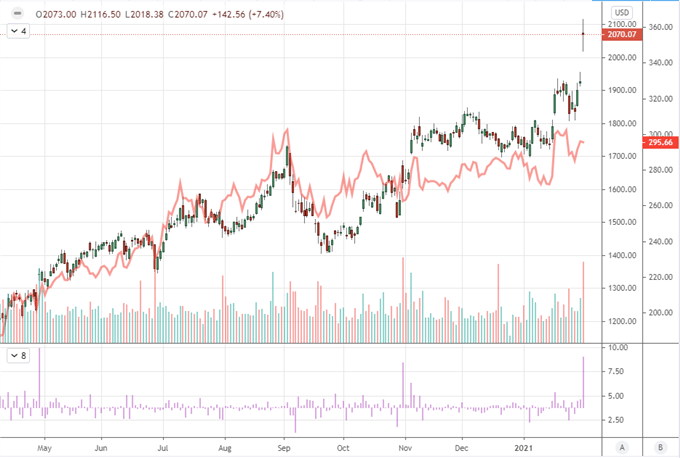
Chart Created on Tradingview Platform
Checking in on the market-at-large, there was a slip in risk-based assets this past session. Global indices, emerging markets, high-yield and many representatives of the FX carry trade were struggling this past session. Notably, the major US stock benchmarks – S&P 500, Dow, Nasdaq 100 and Russell 2000 – were struggling as well. These have been the inspirational leaders for dyed-in-the-wool bulls for years, so their struggle really registers. In particular, the tech-heavy Nasdaq 100 which has led the pack was sitting on the biggest drop among the big US names with a relative retreat versus the S&P 500 the tore it down from a record high ratio. While it could be argued a rotation into ‘value’, that would be better served by an actual advance in said milestones. In short, we are entering the new trading day with a fresh bout of ‘risk off’.
Chart of the Nasdaq 100 Overlaid with the Nasdaq-to-S&P 500 Ratio (Daily)
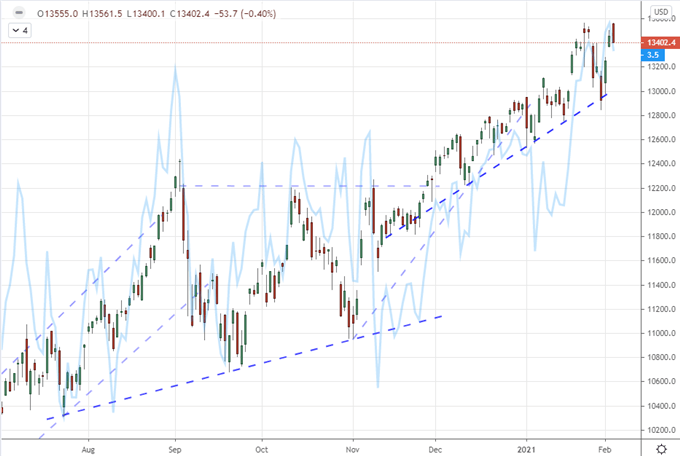
Chart Created on Tradingview Platform
If Markets Start to Stumble, Remember the State of Mind
While I believe it is too early to call the full capsizing of speculative markets, we should nevertheless monitor the collective view. It is simply a calculation of probability and potential: while the probability may still be under the 50-50 threshold, the potential impact should risk aversion set in could be severe. I will keep reiterating that those that contributed to my poll asking for peoples’ view on the time frame for an inevitable turn in sentiment found the large majority believed it would happen in the first half of the current year.
Twitter Poll: When Will Capital Markets Put in for the Next Bear Market
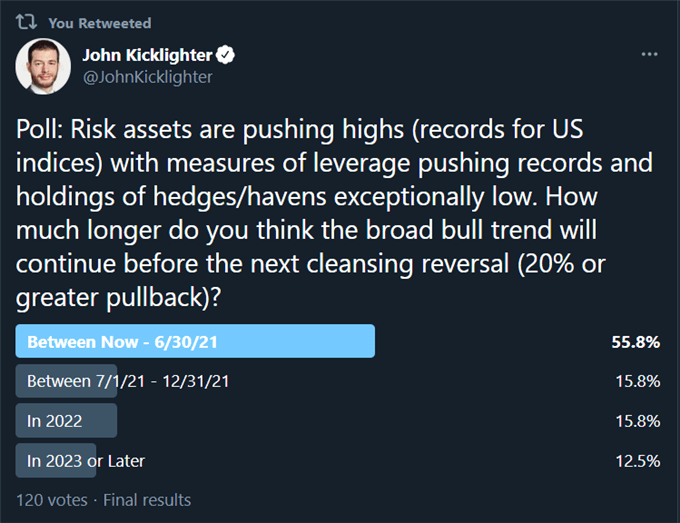
Poll from Twitter.com, @JohnKicklighter
That would further align to the broader population tracking the risk of a ‘market bubble’. While the allure of windfall returns in names familiar to those that are members in Reddit and other social boards has offered some degree of assurance, fear of a implosion has followed. I’ve switched my view from a US focus in Google search for the aforementioned term to worldwide. The results are equally unnerving.
Learn more about some of history’s greatest market bubbles.
Google Trend Search Interest for ‘Market Bubble’ Worldwide
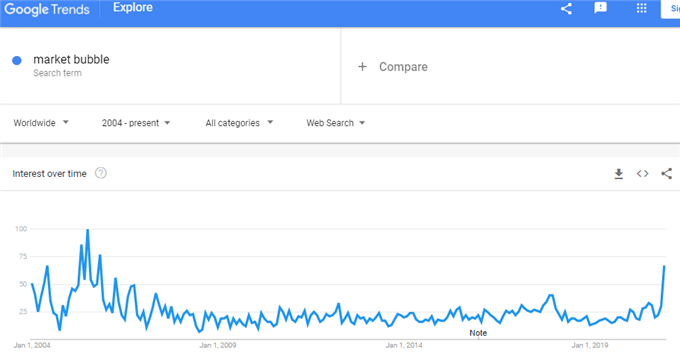
Chart from trends.google.com/trends
The Dollar Majors Offer Technical and Fundamental Opportunity
While the most liquid markets have drawn less interest of late from the retail crowd, it seems the potential is shifting away from the extreme volatility of the thinner assets. The Dollar-based majors seem to hold more than their fair share of opportunity in particular. The USDJPY is one such pair that has flown under my radar – and that is saying something given I entered 2021 with the view that it was one of the best opportunities. While thematically a confused safe haven pair, it does emphasize the Greenback’s benefits-detriments. Yet, my real interest is in its technical picture as its breaks a nearly year-long wedge to move into a larger range. Now 6 days higher, we find it matching the longest consecutive daily run stretching back to October 2016 and congestion still a dominant feature.
| Change in | Longs | Shorts | OI |
| Daily | -2% | 3% | 2% |
| Weekly | 8% | -11% | -8% |
Chart of USDJPY with 50-Day Moving Average and Consecutive Candle Count (Daily)
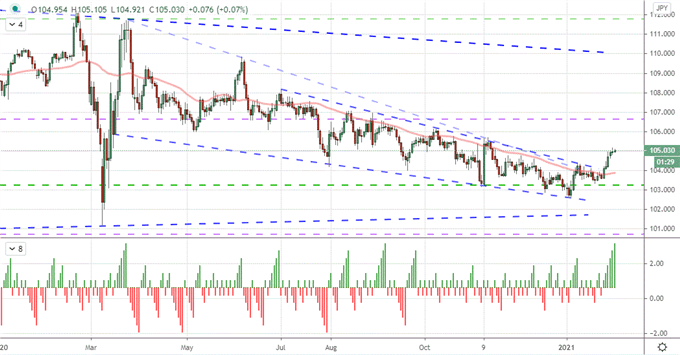
Chart Created on Tradingview Platform
A picture similar to USDJPY but with perhaps an even greater technical build up was EURUSD. We have cleared the 1.2060 neckline of a month-long head-and-shoulders pattern, but it has traded after the break as if nothing happened. Chart patterns alone do not ensure the development of a loaded picture. There needs to be a degree of commitment found in fundamentals – particularly when we are weighing in on larger markets. The news of former ECB President Mario Draghi being asked to form a new Italian government didn’t seem to stir memories of his 2014 drive to push the Euro lower nor did the strong showing in the US ISM services survey this past session motivate the Dollar to rally. We could see something more from the NFPs on Friday, but that seems a stretch so late into the week.
| Change in | Longs | Shorts | OI |
| Daily | -1% | 12% | 2% |
| Weekly | 70% | -48% | 2% |
Chart of EURUSD with 20-Day Moving Average (Daily)
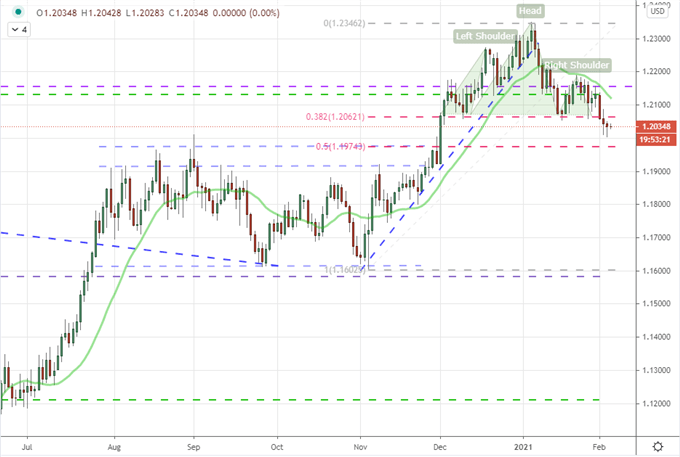
Chart Created on Tradingview Platform
While I’m more than aware that the Dollar pairs have struggled to live up to their potential, I still believe it is worth keeping a very close eye on their development. That is not just a signal to the broader fundamental picture but also a monitor on potential opportunities. Always looking for the convergence of technicals and fundamentals, GBPUSD shows a multi-month rising wedge within a larger rising trend channel where a recent break suggests a tentative rollover. If the Bank of England (BOE) rate decision can spur a retreat in the Sterling, it would find a prone pair in the Cable.
| Change in | Longs | Shorts | OI |
| Daily | -5% | 9% | 0% |
| Weekly | 29% | -28% | 2% |
Chart of GBPUSD with 50-Day Moving Average and 20-Day ATR (Daily)
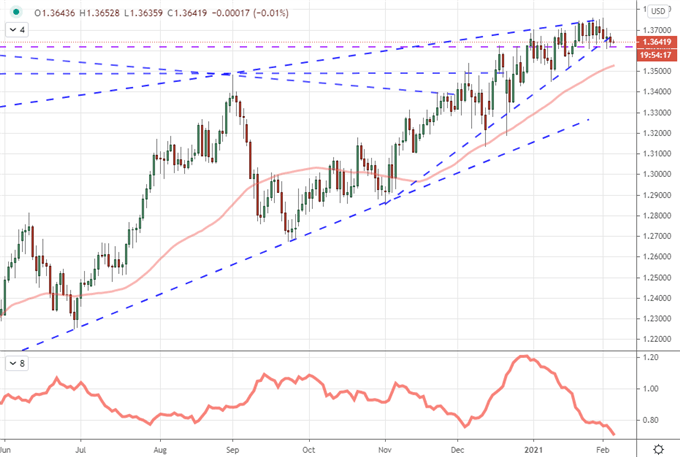
Chart Created on Tradingview Platform