EURUSD, S&P 500 and Bitcoin Talking Points:
- The S&P 500 carved out another week of indecision – a more threatening sign in context of a market stationed at record highs and steadfast fundamental headwinds
- EURUSD is in a similar contrasting position as the smallest week’s range in 12 months urges breakout risk against a backdrop of congestion that may urge a range swing
- Market conditions ahead are defined by engrained complacency that is meeting traditional seasonality factors between Thanksgiving liquidity and year-end conditions
Benchmark Markets Reflect Congestion Yet Tension
Most of the financial market pacers that I follow closed out this past week with notable constraint which will allure those investors seeking the fulfillment of seasonal norms to protect excess risk exposure. With measures like the US indices pushing record highs, those that have stuck to the default bullish line on speculative bearings are placing significant weight in ‘holiday trade’ whether they realize it or not. Take the S&P 500 for example which will start the new trading week just off of its record high. Despite the proximity to levels that draw natural assumptions of some level of self-fulfilling momentum, we have also seen the makings of troubling hesitation. Technical traders will note that the SPX chart followed a spinning top doji in the weekly through Nov 14th with an ‘inside week’ where the range of this most recent week fit neatly within the previous span. That reflects hesitation at a particularly inconvenient phase for this benchmark.


Chart of S&P 500 with 100-Week MovAvg, 100-Week Disparity Index and 1 Week Range (Weekly)
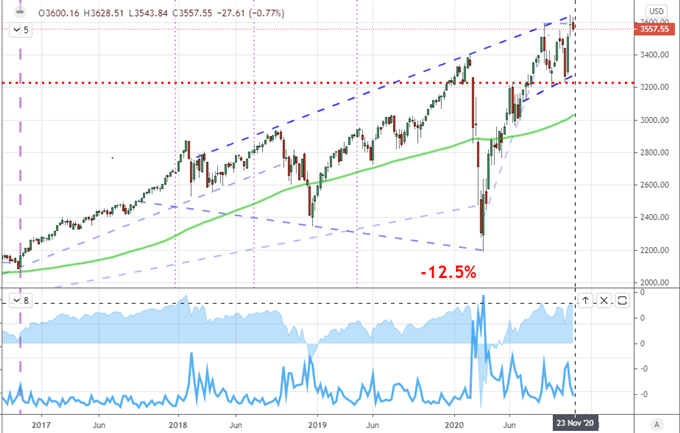
Chart Created on Tradingview Platform
The S&P 500, Dow and other key US equity indies aren’t the only sentiment measures spinning their tires at technically provocative levels. A host of global equity benchmarks like the German DAX and alternative speculative milestones like the EEM emerging market ETF are following the same path. However, the top liquidity benchmark that is making a greater impression on me for following this layout is EURUSD. While it is near a multi-year high of its own, its congestion between 1.1900 and 1.1600 is more thoroughly established over the past four months (reflected in the DXY Dollar Index against 92 support). That makes for a different impression in last week’s range representing the smallest span for the market in almost exactly a year and the fifth smallest weekly range since the Summer 2014 doldrums.
Learn more about technical analysis in our DailyFX Education section.
Chart of EURUSD with 100-Day Moving Average with 1-Week Historical Range (Weekly)
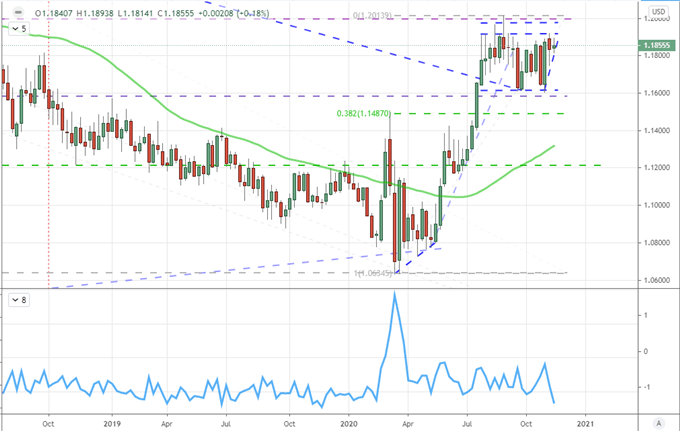
Chart Created on Tradingview Platform
While market inertia being what it is likely keeps these benchmarks from establishing a genuine trend for the time being, it doesn’t preclude the risk of certain controlled volatility. Even short bursts of activity triggered by scheduled event risk or impromptu systemic headlines could urge a breaks. Follow through could be difficult to sustain, but a well-placed move could cater to technical bounds. Consider, for example, a bearish break from EURUSD early next week from its tight constraints which could urge a move to traverse the well-defined but productive range. Retail FX traders (at IG) seem to be leaning toward this possible outcome with net speculative positioning on the IGCS hitting bearish extremes from the past year while open interest remains elevated. A break of 1.1850/00 would still leave a few hundred pips of open field to traverse before the significant technical bound comes into view to force serious contemplation in conviction.


Chart of EURUSD with Net Speculative IG Retail Positioning (8 Hour)
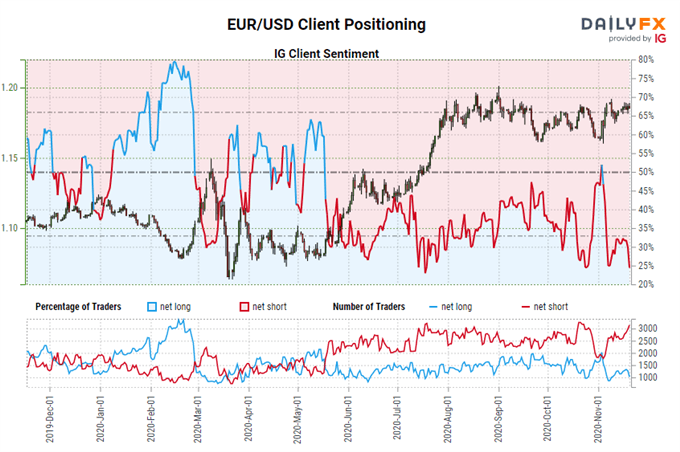
Chart Created on DailyFX
Seasonality Pulls Hard Against Markets but That Doesn’t Promise Volatility Control
We are facing a contrast in technicals and fundamentals that is ultimately being determined by a third factor which I call market conditions. The liquidity and assumptions associated to the market over the next week and month are rooted in well-established seasonality factors. The month of November historically sees a wind down in volatility and volume (via the VIX and S&P 500 respectively) that can sport ‘risk on’ that then carries into the month of December. Those norms can be readily upended by a big-ticket issue that is underrepresented like a further swell in the global pandemic that threatens to pummel economic recovery. However, this week in particular will exert specific pressure against committing to a clear move with the Thursday Thanksgiving holiday in the United States. Not only is that the largest market in the world, we usually find the rest of the globe’s investors going with assumptions of a broad liquidity draw. So, practically speaking, if I were to expect meaningful volatility to show in the week ahead, it would be most likely to take in the first 48 hours with potential sliding sharply in the day before the holiday.
Chart of Seasonal S&P 500 Performance, Volume and VIX
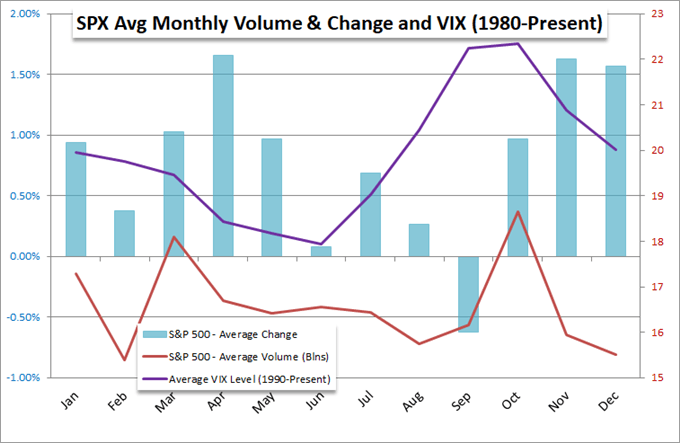
Chart Created by John Kicklighter with Data from Bloomberg
Targeted Event Risk and Systemic Potential
If we are to expect a prompt to upend seasonality and technical constraints; as usual, the most concentrated spark would be meaningful and scheduled event risk. Through the opening session of the week ahead, are due a proxy update on global growth through the month of November. Against the backdrop of the resurgence in coronavirus cases – record highs for the United States and globally – with many countries showing the economic fallout to accompany the human toll, there will be consider heft to what this data suggests. And if that wasn’t enough, the US will additionally have consumer confidence (Conference Board), us personal spending, initial jobless claims, durable goods orders and advanced goods trade data to evaluate all through the first half of the week.
Chart of Global Economic Activity in PMIs (Monthly)
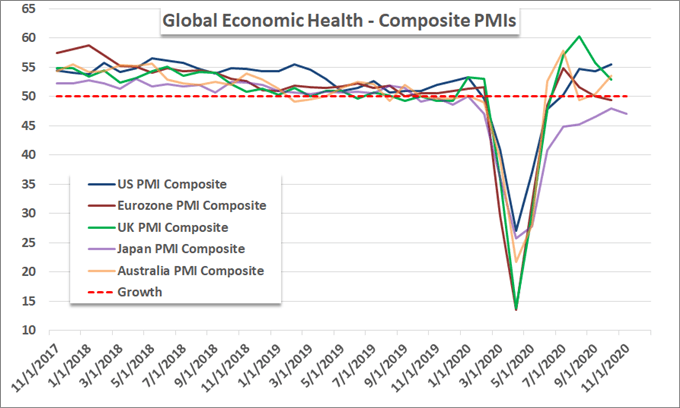
Chart Created by John Kicklighter with Data from Markit
In contrast to discreet economic data releases, we are still facing a host of unresolved fundamental issues that could prompt market response without warning. The most relentless of these various matters remains the second wave of the Covid pandemic. Not only are the cases hitting new peaks but recognition of the risk is showing through in various measures (like search ranking in Google). That in turn threatens economic health through matters like unemployment and raises the dependency on external support (stimulus). Such outside lift is an issue unto itself as the effectiveness is a constant concern. That is particularly true in the United States where no follow up to the first fiscal program has yet to be found since it hit its expiration for supporting consumers back at the end of July. With the US Treasury Secretary seeking the return of emergency funds meant to stabilize the financial backdrop, there is even more unchecked exposure.
Chart of ‘Unemployment’, ‘Stimulus’ and ‘Covid’ Search via Google Trends (Daily)
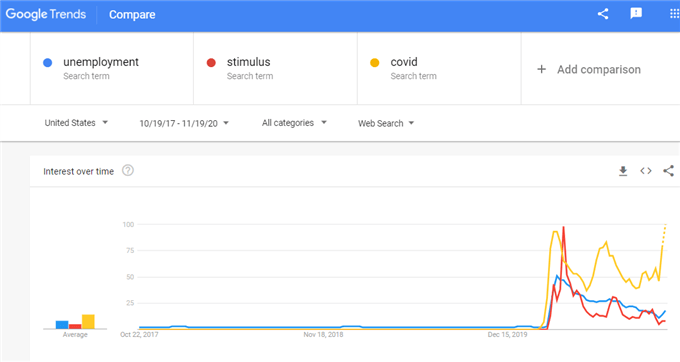
Chart Created on Google Trends
A Market to Keep an Eye On Over Weekend and Through Seasonal Constraints: Bitcoin
As we move through the weekend with full liquidity drain and holiday conditions with partial drawdown with so many markets resorting to congestion, I would highlight one popular asset that is avoided the norms: Bitcoin. This most popular cryptocurrency trades through the weekend and is not hampered by the close of 9-5 capital market exchanges. It is also running an exceptional trend – seven consecutive weeks advance to rush towards record highs – in contradiction to most other assets. This is interesting further as BTCUSD has exhibited a period of strong correlation to more traditional risk assets while at the same time it is frequently watched for its ‘anti-fiat’ properties. Whichever role you believe is more appropriate, this is worth watching.
Chart of Bitcoin with 20-Week Moving Average, Consecutive Candles and 7 Week ROC (Weekly)
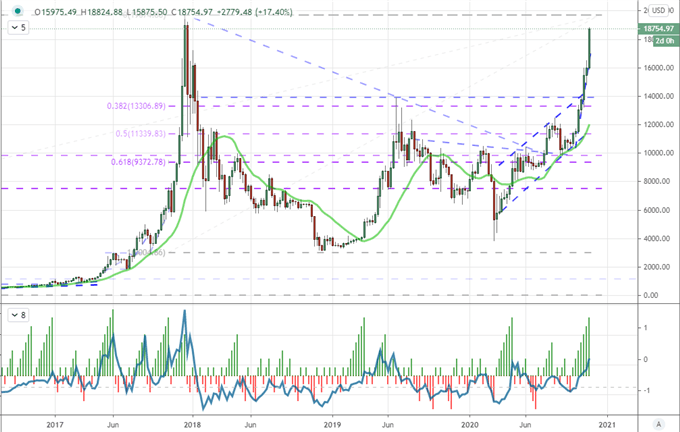
Chart Created on Tradingview Platform


.


