


S&P 500, Dollar, USDCNH, GBPUSD Talking Points:
- Traditional ‘risk’ benchmarks took a turn lower to start the trading week with the biggest daily drop in a month for the S&P 500 and Dow
- While the headlines around expected US stimulus were volatile, the recognition of the US Presidential election in two weeks is a dominant force
- Broad risk assets may be mired in uncertainty but the Dollar is in far better position to play conduit to sparks like US stimulus speculation – in particular USDCNH
Risk Aversion Tips Lower to Start the Week
Speculative benchmarks took a hit to start the new trading week as the weight of an election still two weeks away proves a crushing force to speculative intent. Though the US Presidential election is still a comfortable distance into the horizon at two weeks out, the gravity of the event is so significant that it is influencing market conditions even now. To start this new trading week, there was a shift lower in risk assets that overwhelmed Monday headlines that championed Chinese 3Q GDP and September economic statistics along with easy speculation that suggested US stimulus was still an easy vote away. Sentiment presented a broad shift lower with notable traction catching during the New York session. That would result in a start for the S&P 500 and Dow of little commitment that ultimately developed into the biggest single-day slide in a month. Support is at hand for both benchmarks into Tuesday – at 3,400 and 28,000 respectively which happens to align to 50-day moving averages.

Chart of S&P 500 with 50, 100-Day Moving Averages and 1-Day Rate of Change (Daily)
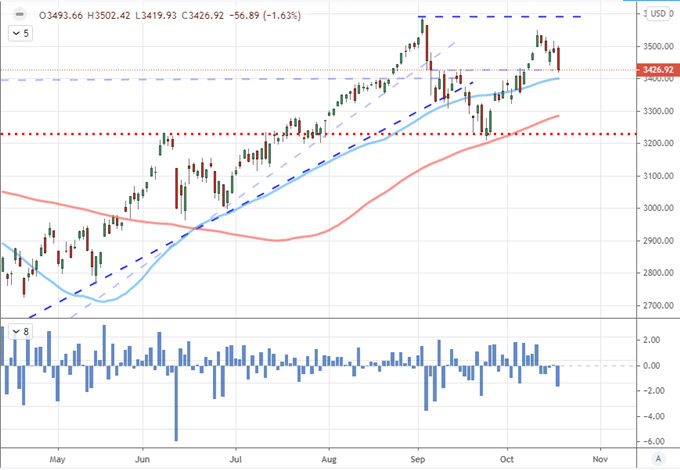
Chart Created on Tradingview Platform
Despite the slump to start the week and the weight of fundamental issues ahead – or perhaps because of them – the potential for a full-scale bear trend looks seriously improbable. On the technical side, we are sidling up to levels that I would consider interim support within much broader range. For the S&P 500, subsequent lower bounds aligned to the 100-day moving average (~3,300) and the September swing low with technical ‘correction’ designation (~3,200) present much more remarkable milestone. To clear these barriers is made more difficult owing to the anticipation of election uncertainty at the start of next month. We can see that expectation clearly in implied volatility measures across a host of financial products. Yet, most are probably familiar with the VIX volatility index where the October-November futures contrast spread reflect acute concern.
Read more on how the VIX has acted around previous US Presidential elections in our special report analyzing the ‘fear gauge’ during this cycle.
Chart of S&P 500 withVIX October-November Spread (Daily)
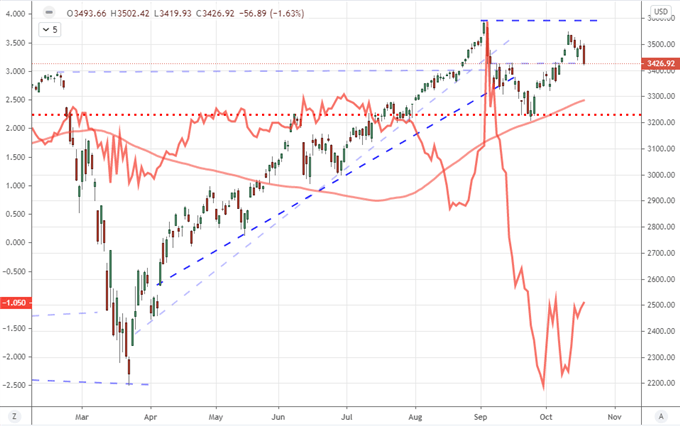
Chart Created on Tradingview Platform
The Restraint from Election Anticipation and Potential in Stimulus
Taking a different look at the gravitational pull that an event like the US election may have – even two weeks out – we find Google search interest in ‘election volatility’ pushing levels only comparable to the 2016 peak reaching as far back as data is available to 2004. If a contested election can exert that much influence over the global financial system, what money management fund, large investor, sovereign or other weighty market participant with a longer time horizon is going to adopt a large an explicit view on capital market bearing this close to the event horizon? It is important to ask his question not from the perspective of a short-term retail trader but rather the stalwarts of the financial system. It is an improbable venture for this group – though that doesn’t mean that volatility won’t be a feature of immediate landscape.
Chart of Google Search Ranking in the US for ‘Election Volatility’ and ‘Stimulus Hopes’
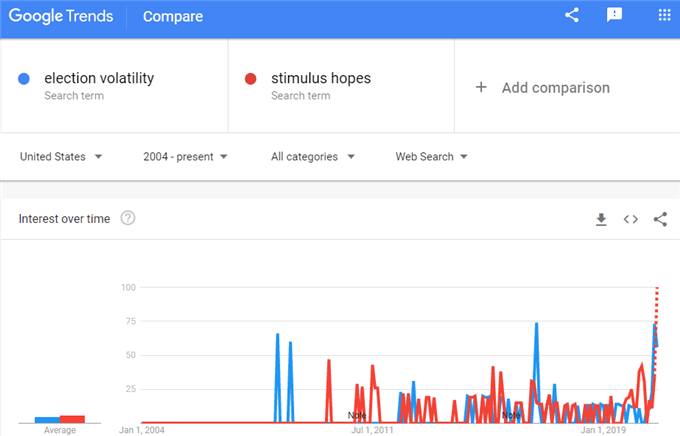
Chart created by John Kicklighter with data from Google Trends
There are a few fundamental themes of note this week which will rouse speculative fear and greed. That said, these flares are more likely to act as points of volatility with short-term breaks and less as the imminent sparks of systemic trends. The health check in global growth is once such them to track between Monday’s Chinese 3Q GDP and Friday’s October global PMIs. Alternatively, the central bank rhetoric covered by a busy docket for speeches could also nudge us off a balanced axis. ECB President Lagarde suggested permanent debt holding should be considered in Europe, BOE Governor Bailey warned the outlook was firmly tipped to the downside though he wasn’t warm to negative rates as the economy struggles and Fed Chair Powell talked on digital currency in these uncertain times. Yet, if there were one theme of particular merit that I were watching for near-term potency, it would be the expectations around US stimulus. Despite House Speaker Pelosi warning an end-of-day Tuesday deadline was in the air if a deal could be implemented before the election, it didn’t seem to alter the probabilities of the dispute. Interest in this external infusion still dominates as a market theme according to search. And, paired with split fundamental concerns, I still believe the Dollar is the more potent outlet for this matter. This is less due to the technical picture than the relative nature to which this issue caters.
Chart of DXY US Dollar Index with 100-Day Moving Average (Daily)
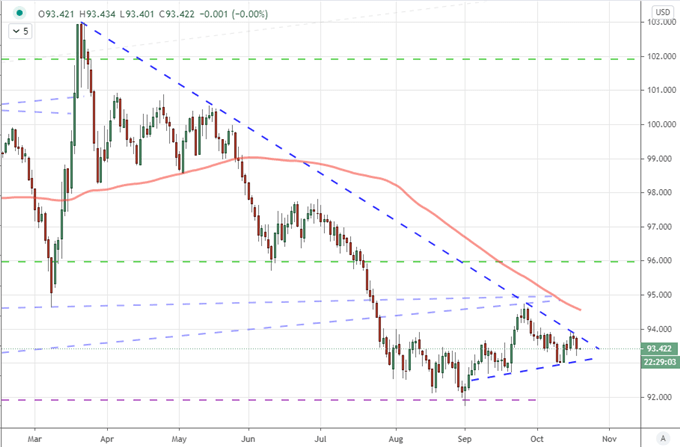
Chart Created on Tradingview Platform
Dollar Pairs to Watch for the Near Future
If there were a counterpart that seemed particularly adept to relative stimulus tracking, it would be EURUSD. Lagarde’s remarks Thursday remind us that the past few months for this benchmark pair have been in at least part a reflection of economic potentially artificially bolstered by these external means. That said, this pair doesn’t seem to have the most keen willingness to move even if so motivated. Fundamentally, a US stimulus release would be both a boon to the Dollar and risk trends, which would seem good convergence for the likes of USDJPY, though this pair has struggled with any kind of traction. A sudden stop to negotiations made clear as a strict impasse is unlikely to occur (again), so a binary negative outcome is less likely. Yet, other sudden developments cannot be ruled out as counter winds. Take for example GBPUSD which has the suggestion by BOE Governor Bailey that he isn’t considering negative rates even as the rise in COVID cases is starting to see the UK economy throttled and trade negotiations with the EU are extraordinarily uncertain.
| Change in | Longs | Shorts | OI |
| Daily | -2% | -2% | -2% |
| Weekly | 5% | 3% | 4% |
Chart of GBPUSD with 50 and 100-Day Moving Averages (Daily)
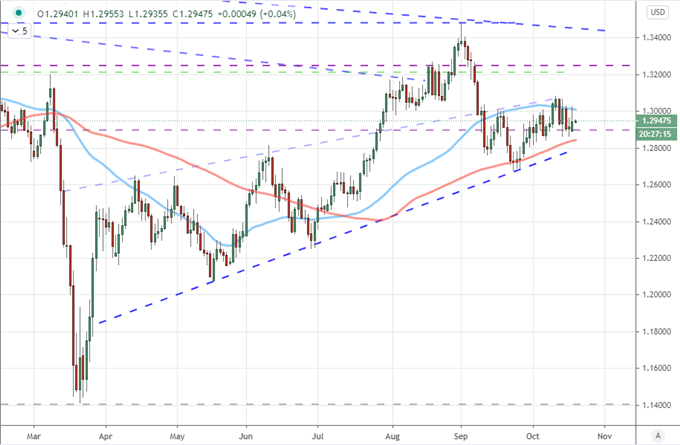
Chart Created on Tradingview Platform
If there were one Dollar pair that I believe has better footing than most others to support a Greenback rebound, it would be USDCNH. While many believe this pair is a ‘manipulated’ picture of control meant to reflect a certain view of trade relations and economic potential, enough natural capital flow will make this a difficult exchange rate to contain. That is particularly true given the greater attention afforded to its progress these past four months. Pushing a more-than-two-year low, if a sudden release of US stimulus boosts the Greenback for a relative benefit, this is a discount that could align to the complicated ‘risk on’ response measured in other areas.
Chart of USDCNH with 50, 100-Day Moving Averages (Daily)
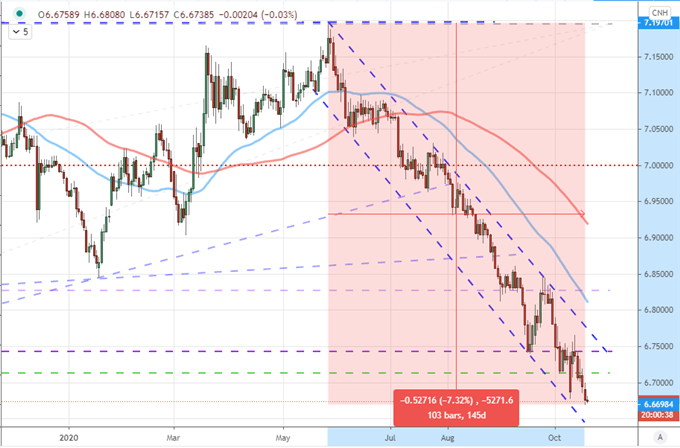
Chart Created on Tradingview Platform

If you want to download my Manic-Crisis calendar, you can find the updated file here.
.


