


Dollar, S&P 500, Pound Talking Points:
- The S&P 500 and Dow managed to pull out of -7 percent and -11 percent tumbles respective this past week, but the threat of a revived collapse looms
- Top scheduled event risk for the coming week is the Federal Reserve’s rate decision – a Dollar and indices shark – but there is more than one central bank meeting
- Other key risk ahead includes Chinese data, US sentiment, Japan’s Lib Dem party leadership vote, stimulus chatter, Covid case updates and errant US election headlines
Putting a Pin in the Swell of Volatility, Reversal in Risk Trends
The transition from ‘Summer Doldrums’ to Fall trading is still underway, but volatility is already proving a hallmark of our current condition. The S&P 500 and Nasdaq 100 benchmark US indices were amplifiers of the swing with a shift from record highs to substantial losses – a -7.7 percent and -12 percent peak-to-trough reversal thus far with Friday’s intraday lows. There are technical levels that the industrious speculative trader can point to as a ledge holding back a freefall, but I remain focused on underlying market conditions. As intense as the retreat has been through periods this past week – not to mention the breadth of the slide – this past week, there is still considerable change that needs to be occur before we move from complacency to open deleveraging. The ingredients are there however…
| Change in | Longs | Shorts | OI |
| Daily | -5% | -5% | -5% |
| Weekly | 27% | -24% | -6% |
Chart of S&P 500 with 20-Day, 50-Day Moving Averages, COT Net Spec and Volume (Daily)
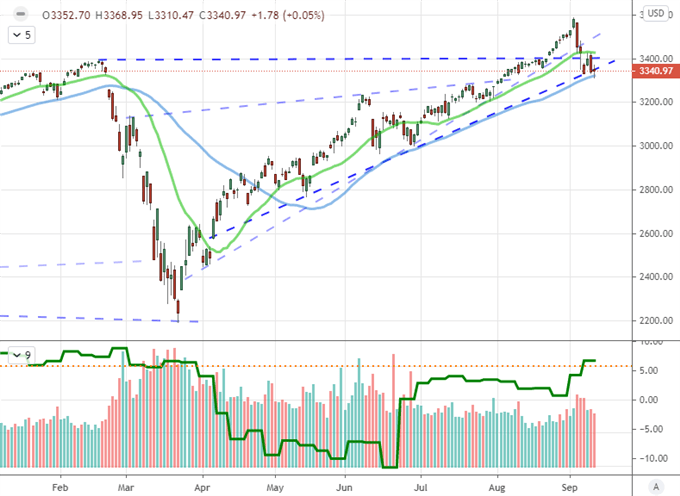
Chart Created on Tradingview Platform
Remarkably, if you were to look at other measures of speculative intention – global equity indices, carry trade, junk bonds, emerging market assets, etc – the same concern but reticence to commit was showing through. That correlation across otherwise unrelated assets is a sign of ‘breadth’ in sentiment which suggests any sudden turns of fear will find a market prone to significant unwinding. Should fear tap into systemic issues such as fear of a failed economic recovery, there is a significant premium to burn for the world’s most liquid and overbought benchmarks.
Learn more about the three types of general Forex market analysis in our education section.
Chart of Risk Trend Intensity
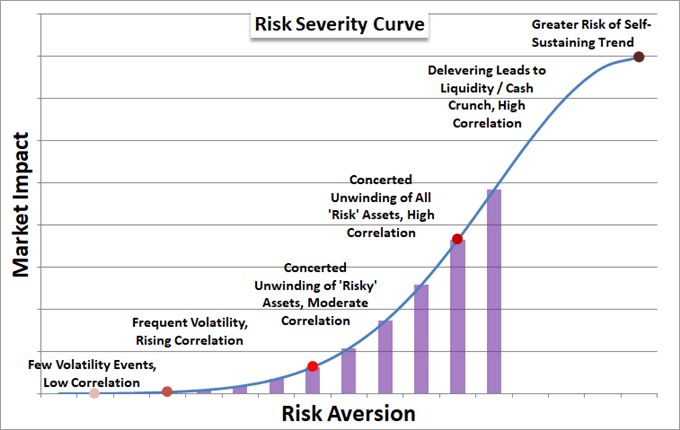
Chart Created by John Kicklighter
Top Event Risk Next Week: The FOMC Rate Decision
There is plenty of high-level event risk on docket next week, but a particular theme arises out of the scheduled listings in monetary policy. While there are a number of central bank meetings on the scheduled, the Federal Reserve’s Open Market Committee’s (FOMC) gathering is clearly the most potent of the central bank updates on tap. The world’s largest bank is not expected to change its benchmark rate nor its stimulus program, but Chairman Powell’s announcement of a policy target shift late last month signals a group willing to respond to the uncertainty the world faces. What’s more, this month’s Fed meeting is a quarterly gathering in which the market has been trained to expect updated growth forecasts which have become more valuable than gold…at least in terms of market movement.
Chart of Speculative Positioning in S&P 500 CFDs from IG (Daily)
Poll from Twitter.com, @JohnKicklighter
In keeping tabs on the Dollar, the DXY index is always an appropriate benchmark to follow. However, the world’s most liquid pair, EURUSD, may offer more fundamental interest given the nuance it highlights. The cross has the ECB’s remarkable surge in stimulus from the past months to contend with – with the approval of an additional 750 billion euros in stimulus just a few months ago reviving the charge from 1.1400 on to 1.2000. Can the Fed balance such a move? Would its efforts register as a contribution to a ‘V-shaped’ recovery for the US or stand as a weight to the local currency? That remains to be seen.
| Change in | Longs | Shorts | OI |
| Daily | 0% | -8% | -3% |
| Weekly | -4% | -4% | -4% |
Chart of EURUSD with 20-Day Moving Average Daily ‘Wicks’ (Daily)
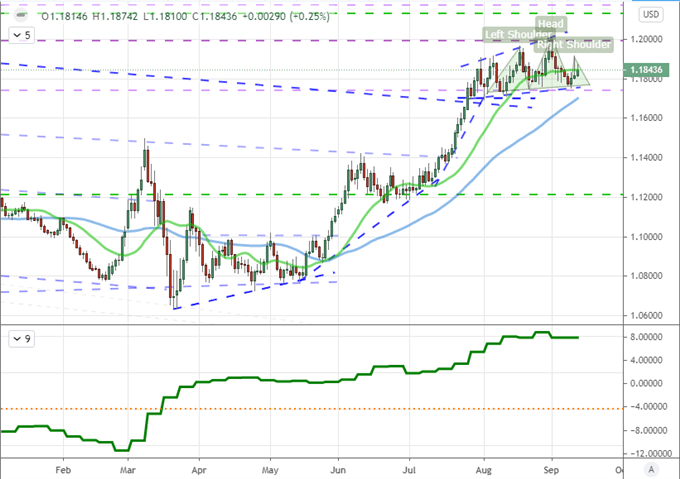
Chart Created on Tradingview Platform
While the United States’ monetary policy update is the most influential rate decision on tap, it certainly isn’t the only such gathering that should be monitored. The Bank of England (BOE) and Bank of Japan (BOJ) decisions are also significant events. For the former, the environment tilled by the EU-UK trade tensions spurred these past few weeks sets a backdrop prone to sparks. Perhaps less dynamic, the BOJ meeting will still find a springboard of potential volatility thanks to the uncertain political backdrop in Japan. The Liberal Democratic Party is due to vote for new leadership this week, and the connections between Japan’s monetary policy, fiscal policy and economic policy decision is perhaps the most material of the developed world.
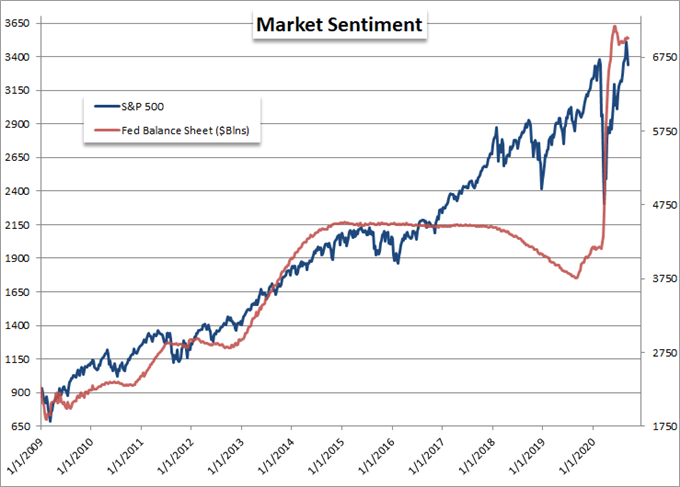
Chart of Major Central Bank Stimulus Programs (Monthly)
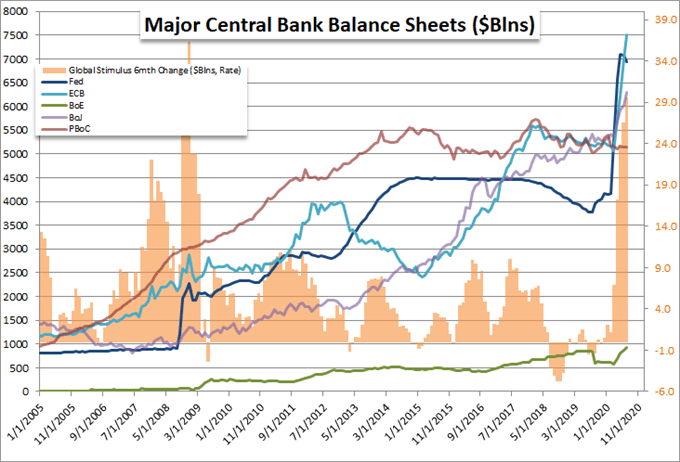
Chart Created by John Kicklighter with Data from Fed Economic Database
The ‘Other’ Fundamental Sparks Ahead: UK Trade; Elections; Trade Wars
In other fundamental avenues, there are plenty of fundamental turns that the market can take; but I will be watching some of the more persistent systemic issues for market leverage ahead. For the British Pound and local UK assets, the sharp escalation in trade dispute between Prime Minister Boris Johnson’s government and the EU collection revives a familiar Brexit concern. Both sides are once again playing a game of chicken with a lean against the Withdrawal Agreement. Pairs like GBPUSD and EURGBP are frequent reference points for those tracking this fundamental course, but crosses like GBPAUD can present an interesting picture of their own.
Chart of GBPAUD with 20 and 100-Day Moving Averages, Consecutive Candles (Daily)
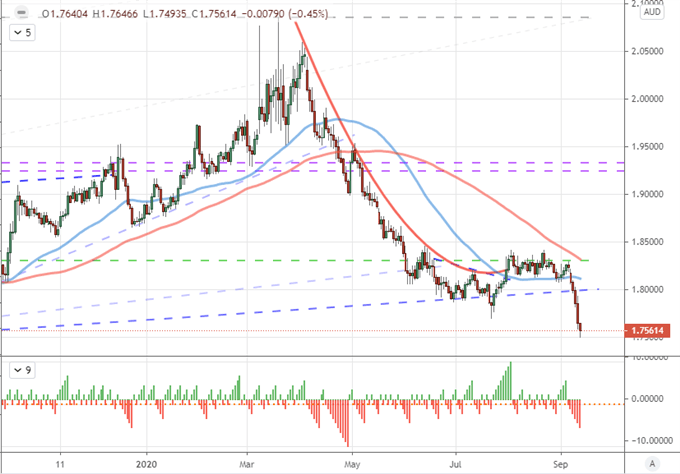
Chart Created on Tradingview Platform
Turning back to the Dollar, the Fed decision is the most prominent event on my radar. That said, it isn’t the only event scheduled with serious weight. On the data front, the US retail sales and University of Michigan consumer sentiment survey are worthwhile measures of economic health to follow. Should both turn to retreat, it would be a worrying sign for the world’s largest economy…and potentially the world. Further afield, the systemic matters of risk trends and anticipation for election volatility should be tracked. For the latter, the markets don’t seem to fully appreciate the risk at hand. Don’t underestimate this volatility pot hole.
Chart of DXY Dollar Index, US 10-Year Yield in Green, ‘TRUMP’ Index in Red (Daily)
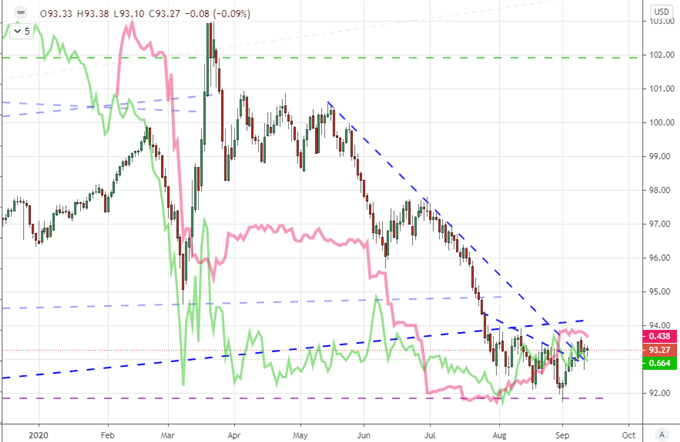
Chart Created on Tradingview Platform
In a bigger picture perspective, the assessment of US economic policy uncertainty has actually retreated – remarkable given the November 3rd election date. Nevertheless, global uncertainty in economic policy remains troublingly high. Despite the ebb in immediate pandemic economic pressure, the outlook for what effective policy support is on tap remains troublingly elevated.
Chart of Global Economic Policy Uncertainty Index (Daily)
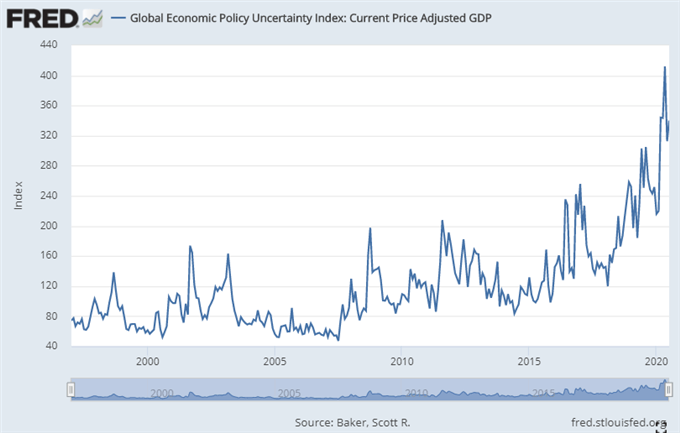
Chart from Federal Reserve Economic Database
Another asymmetric fundamental risk ahead is the ever-present risk behind trade relations. The EU-UK tensions are just one example of tension. The United States’ lashing out is another well- rooted threat to collaborative global growth. The US-China relationship for example continues to deteriorate, even if the market doesn’t have the wherewithal to track the situation each step of the way. It would be the height of ignorance to ignore the threat this poses not just to the likes of USDCNH but broader risk trends themselves.
Chart of Trade Policy Uncertainty Index (Daily)
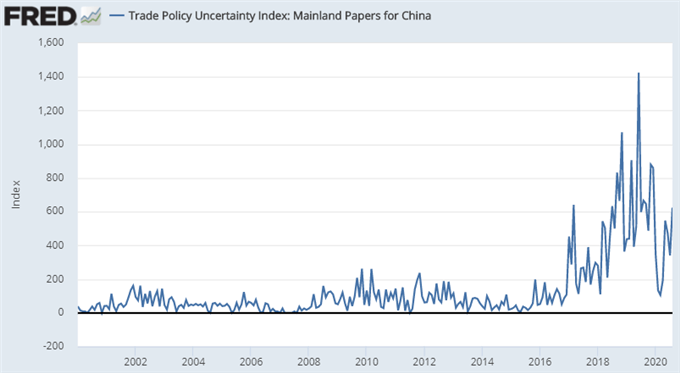
Chart from Federal Reserve Economic Database

If you want to download my Manic-Crisis calendar, you can find the updated file here.
.


