


Dollar, EURUSD, S&P 500 Talking Points:
- The S&P 500 continues to frustrate those looking for a breakout or trend, but room for ranging is quickly running out for this benchmark
- Global risk assets are similarly beset by a lack of speculative conviction – a by-product of seasonal and systemic pressures
- Top fundamental event risk is a rare global update on timely growth performance in August PMIs, with V-shaped recovery hopes battling recent data’s fading
A Breakout Without Conviction is More Likely to Frustrate than Prompt a Trend
If you are a trader that seeks out meaningful volatility or substantial trends – two considerations which tend to encompass a good portion of the speculative rank – these markets have likely been particularly frustrating. Sparks of volatility have flown around unscheduled by systemically important themes, yet there has been little persistence through these seasonally drained conditions. Further, breaks have more often played out as ‘false’ moves whereby even the retreat runs out of gas.
The S&P 500 swung from a record high (on paper) to a sharp correction without rousing any serious cues that a trend is at hand. There remains an ascending triangle formed between the prominent highs of 3,400 and the relentless crawl higher in support from late March. Projecting the congestion that has developed these past five months suggests we simply run out of room within the next two or three active trading sessions. For me, that looks like the makings of a break, but if there isn’t a serious charge behind the technical move; it could readily succumb to hollowed markets.
Learn more about the three types of general Forex market analysis in our education section.

Chart of S&P 500 with 20-Day Moving Average (Daily)
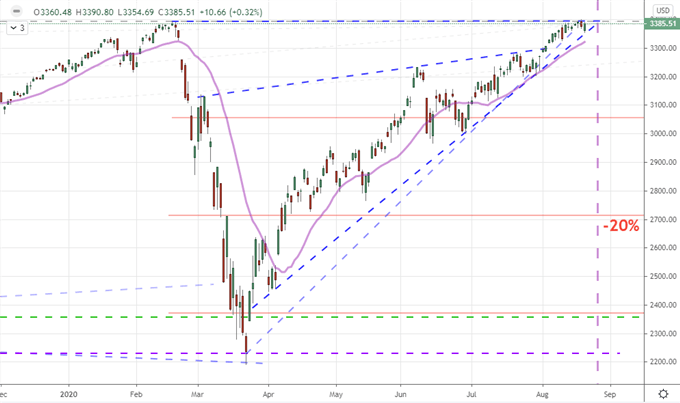
Chart Created on Tradingview Platform
Despite the consistent picture of oppression around building conviction, I always hold out the possibility for a swell in risk trends and a general transition in underlying conditions – ‘fortune favors the prepared’. Circumstances are such that ‘risk aversion’ is more likely to catch traction than ‘risk appetite’. And, if I’m looking for conviction, my preference is too gauge momentum across the range of representative speculative benchmarks. Where singular breaks pop up, like the EEM Emerging Market ETF below, I defer to what actions investors are taking broadly to make my assessment. Thus far, provocation seems to be arising from technical patterns born of anchored conditions.
Chart of EEM Emerging Market ETF with 20-Day Moving Average (Daily)
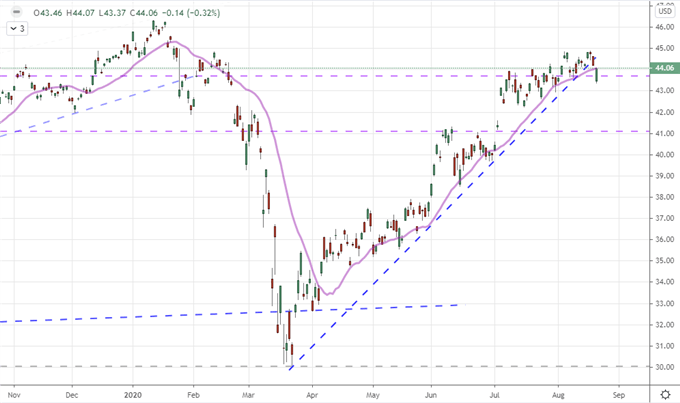
Chart Created on Tradingview Platform
Where the Fundamental Potency Resides To Close This Week
There are a few areas that I am keeping close tabs on for unexpected swells in volatility. The possibility of a stimulus compromise in the US is still a possible, abrupt development. The pandemic is another area were investors can find their sensibitilities stirred by a jump in the curve or announcement of a vaccine. Trade wars is one area that I find creates active vortices which could quickly pull traders in. Following the drop in the Shanghai Composite and USDCNH after remarks of icy relations from President Trump, the White House Chief Economic Adviser voiced optimism with the trade deal in place.
Chart of Shanghai Composite with 50-Day Moving Average (Daily)
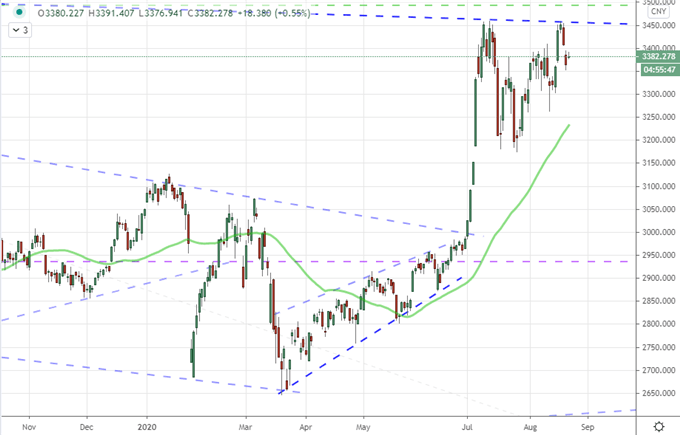
Chart Created on Tradingview Platform
When it comes to drawing the mass’s attention for genuine momentum, scheduled event risk can play an indelible role to starting the ball rolling. As it happens, Friday brings the most potent run of data for the global calendar with a focus on economic activity. Though central banks, governments and global organizations continue to voice caution about the recovery from the ‘Great Shutdown’, the market seems to price in a full V-shaped recovery. Data the past months has supported a quick rebound, but more recent statistics with shorter durations – like the initial jobless claims – are showing that pace fading quickly. If the PMIs from Australia, Japan, Eurozone, UK and US continue to inch higher; the markets are likely to take it at face value and stick with the generous optimism already priced in. Alternatively, should it signal risk to the ‘V’, that is where real interest may arise.
Chart of JPMorgan Global PMIs Measure (Monthly)
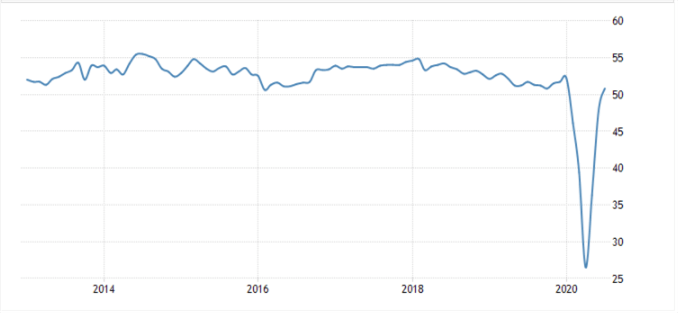
Chart Created on TradingEconomics
Weighty Event Risk Isn’t Just a Systemic Matter
As we see the monthly (August) growth updates progressively cross the wires through the Friday session, I will also eagerly assess whether there is divergence growing between regions. We have seen an appetite for relative yields and restraint in monetary accommodation of past years shift to a preference for recovery pace and willingness of policy groups to fuel that rebound. If, for example, the difference in coronavirus containment efforts, fiscal stimulus efforts and unorthodox monetary policy can move EURUSD; a more definitive skew in growth could certainly alter its course.
Twitter Poll: Is EURUSD Facing a Breakout, Reversal or More Struggle?
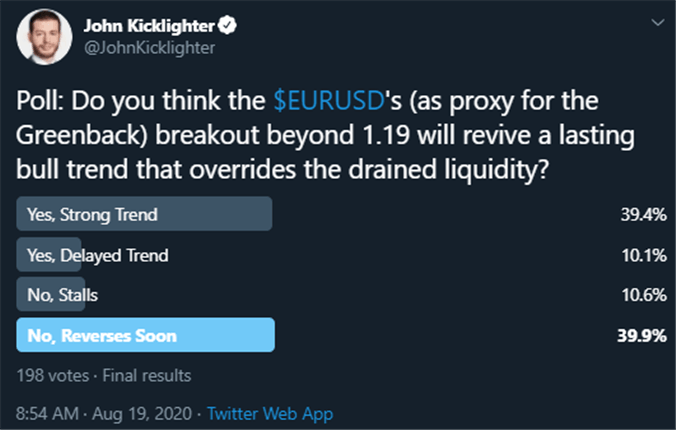
Poll from Twitter.com, @JohnKicklighter
Taking a look at the benchmark FX pair, the failed effort to break 1.1900 has likely taken a lot of wind out of the sails of expectant bulls. Bullish progress will now be met with considerable skepticism and there is a 100-pip buffer before we even approach the new multi-year high. It is even further a trek to get to the range low of 1.1700 before we can suggest a break is at hand. If there is a move for Friday, it looks more likely to be a swing within this range – with the break more likely out to next week at the earliest.
| Change in | Longs | Shorts | OI |
| Daily | -10% | -4% | -8% |
| Weekly | -13% | 35% | 0% |
Chart of EURUSD with German-US 2-Year Yield Spread and Net Spec Futures Positioning (Weekly)
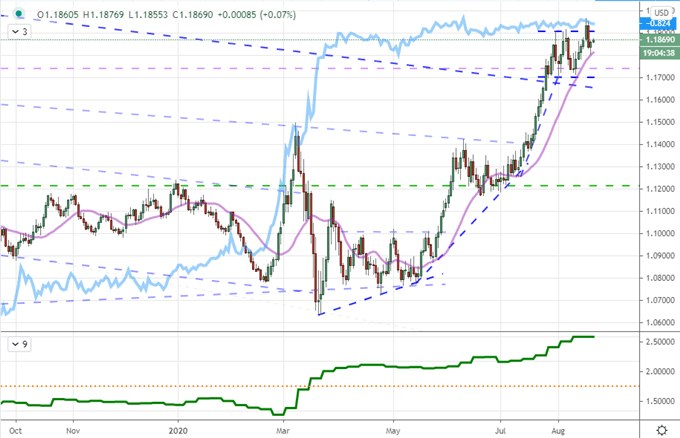
Chart Created on Tradingview Platform
With a pair like EURUSD or GBPUSD, technicians may not be as eager to chase a difficult-to-forge trend this late in the week’s liquidity. However, a pair that hasn’t triggered its technical fuse can still read as more potent than conditions may offer. AUDUSD and NZDUSD are such pairs. The latter has formed a head-and-shoulders pattern while the RBNZ is toying with further efforts to devalue the Kiwi. AUDUSD is a risk-tied cross that has seen its Chinese connections conveniently wane as relations have suffered. A breakdown here could draw as much attention as a slide from the S&P 500
| Change in | Longs | Shorts | OI |
| Daily | -8% | -4% | -7% |
| Weekly | -3% | 49% | 4% |
Chart of AUDUSD with S&P 500 and Net Speculative Futures Positioning (Daily)
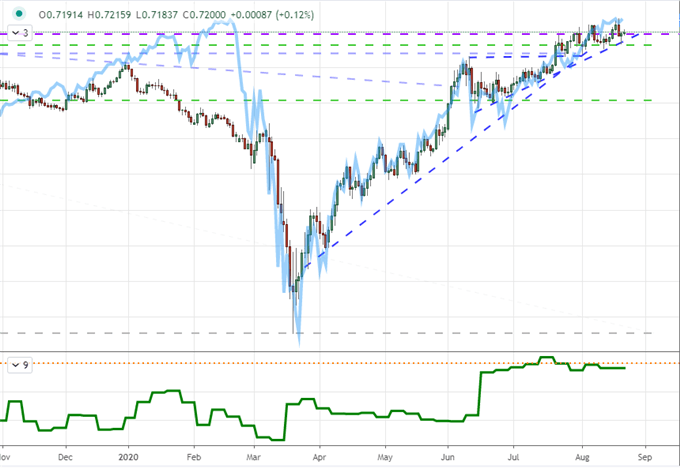
Chart Created on Tradingview Platform

If you want to download my Manic-Crisis calendar, you can find the updated file here.
.


