


S&P 500, Gold, EURUSD, USDCAD Talking Points:
- The S&P 500 is within easy reach of a record high but general risk conditions directed by liquidity and market condition are in poor condition for trend
- USDCAD is perhaps the most laden major for event risk between US retail sales, industrial production, consumer sentiment and Canadian manufacturing sales
- EURUSD should be monitored for more systemic themes, with congestion forged by competing themes like diverging stimulus efforts and coronavirus cases
Market Conditions Will Override Technicals When it Comes to S&P 500 Highs
As my preferred measure among imperfect ‘risk benchmarks’, the S&P 500’s proximity to its record high – on both a close and intraday high basis – is drawing heavy scrutiny. For some, this high profile overhead is acting as magnet that will inevitably lead to a break. Yet, we should consider for this high probability scenario: if we see a record high, is there necessarily follow through to establish the roots of a new trend? From the technical perspective, the spark is clear, but the fundamentals present a more opaque situation. A surplus of systemically-important themes – the pandemic, V-shaped recovery, trade wars, stimulus limitations, etc. – is competing for the ‘market’s’ attention which can suppress conviction via any one single node. Yet, it is market conditions that truly directs my views on the market. Liquidity seems too uneven to forge a genuine trend…bullish or bearish.

Chart of S&P 500 with 20-Day Moving Average and 5-Day Trading Range (Daily)
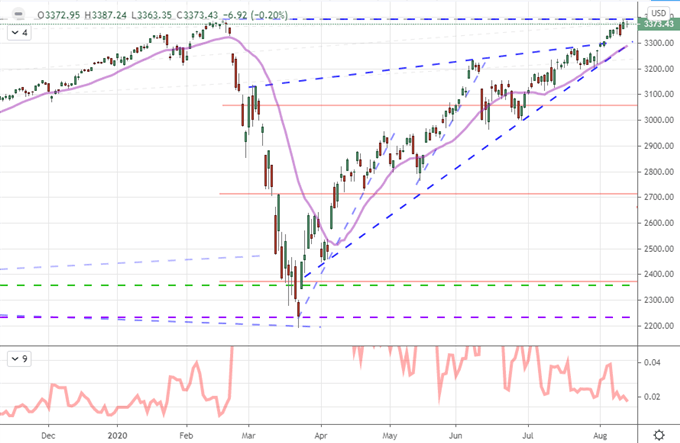
Chart Created on Tradingview Platform
As I have mentioned previously, August represents one of the most repressed calendar months of the year. From the S&P 500’s perspective, it is the most deflated month in terms of volume on a trading-day basis while the VIX typically still struggles through the summer lull. That is a powerful draw on risk appetite. Through risk trends, it is further worth noting that this is not just a phenomena for US indices. There have been a host of benchmarks that I like to refer to for a broad view of sentiment that represent struggle. Not a common feature in my analysis, the popular Australian ASX 200 equity index presented one of the most straightforward technical checks with a 200-day moving average hold and reversal at 6,200.
Chart of ASX 200 with 200-Day Moving Average (Daily)
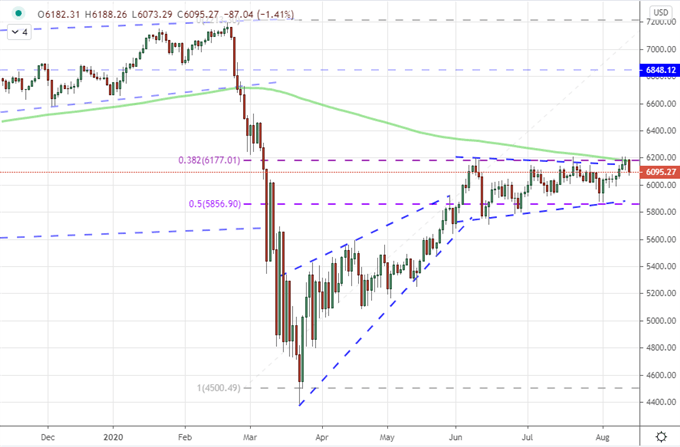
Chart Created on Tradingview Platform
A Rebound in Gold and Debate Over Its Motivations
The market conditions surrounding risk assets is perhaps the most indicative overview of what we are dealing with at present. Nevertheless, there can absolutely be unique outlets of sentiment that deserve our attention. The ‘frequent safe haven but more appropriate alternative to fiat’ gold retained traction this past session. Following Tuesday’s sharpest decline since the April 2013 crash, there was serious debate over the systemic fundamental elements that have charged this assets in previous years. In my poll, the rise in yields was selected as the benchmark driver, but that correlation has clearly waned this past trading day. While US Treasury yields advance alongside global counterparts, the default appeal of this alternative-to-fiat wanes; so why did the metal advance this past session alongside US 10-year wields?
Twitter Poll: What Drove Gold’s Sharp Decline?
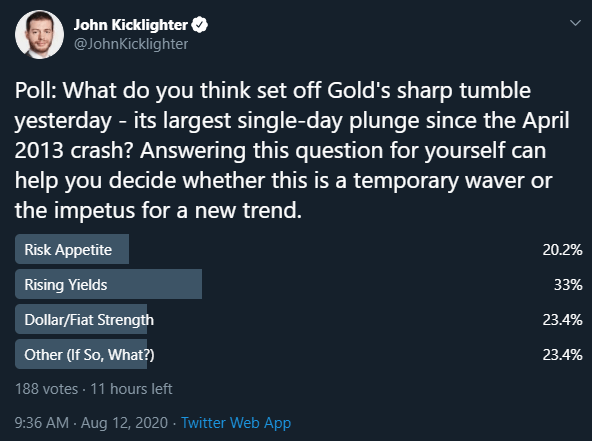
Poll from Twitter.com, @JohnKicklighter
There is much debate to be had in gold’s role as a safe haven, an alternative to popular financial assets and as a direct foil to the Dollar. These different roles will no doubt see a regular draw on interest around the commodity, but it will struggle to throw the market off course. As a haven that bolstered by external stimulus rather than suppressed by it, there are few market benchmarks that carry as much weigh as the precious metal.
Chart of Gold with 50-Day Moving Average and Net Speculative Positioning (Daily)
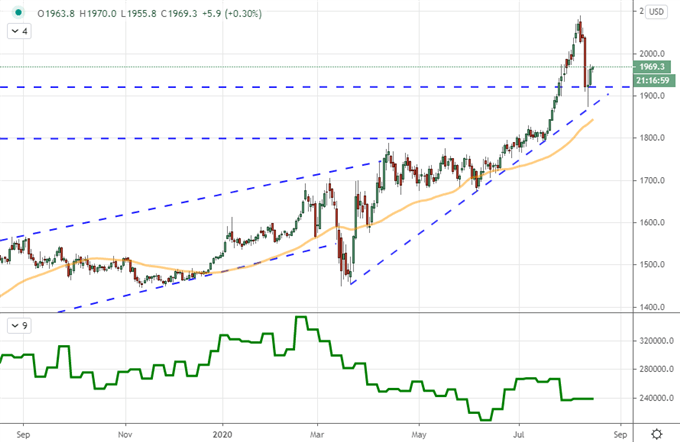
Chart Created on Tradingview Platform
One particularly deep measure of gold buoyancy is the proliferation of stimulus. As more support is infused into the system, it takes Dollar, Euros, Pounds and Yen to facilitate that kind of support. While we may see a relative value arise in two currencies that reflect competing monetary policy efforts and growth potential (like EURUSD), that shouldn’t distract us from the reality that a jump in external support will universally undermine the financial system. Some believe this shift will support gold and others Bitcoin. I believe it is a consideration in relation to liquidity weight, but I will certainly monitor relative currency factors.
Chart of Major Central Banks Balance Sheets in $Billions (Monthly)
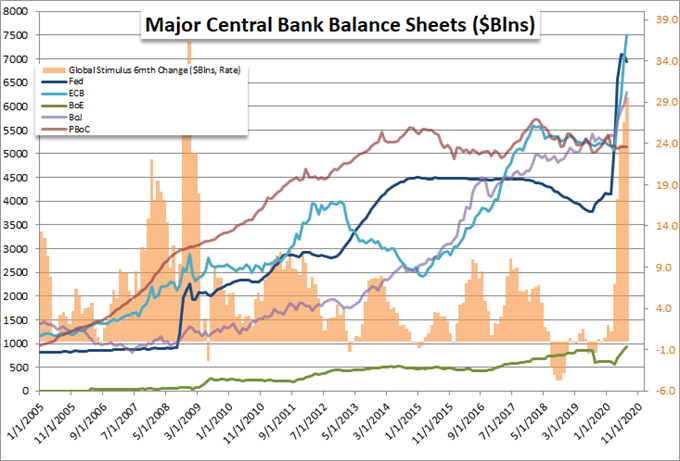
Chart Created by John Kicklighter with Data from Bloomberg
Dollar Says A lot About the Markets but EURUSD and USDCAD Touch Different Extremes
| Change in | Longs | Shorts | OI |
| Daily | -17% | 6% | -7% |
| Weekly | -22% | 17% | -8% |
Chart of EURUSD Overlaid with German-US Confirmed COVID Cases (Daily)
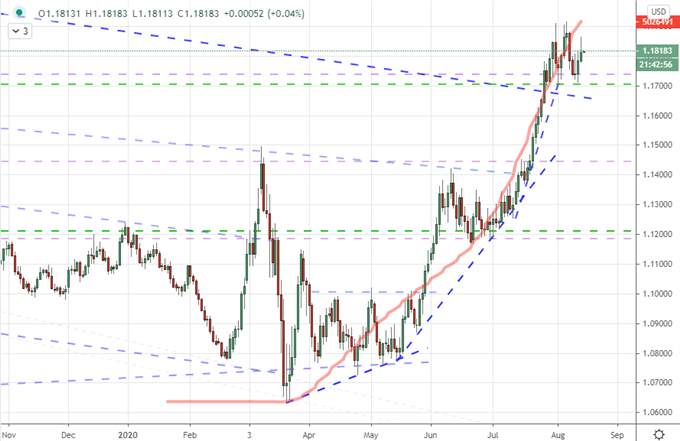
Chart Created on Tradingview Platform
Speaking of relative considerations, the EURUSD is one of the most potent fundamental proxies of 2020. The world’s most liquid exchange rate has climbed over 11 percent from this year’s lows. That said, the past weeks have proven quite the struggle. There is some degree of event risk ahead, but I don’t believe it carries the opportunity to spark a necessary EURUSD break with any meaningful follow through. Relative pandemic fight, stimulus approvals and growth views set among the masses.
Chart of EURUSD Over Ratio of ECB-Fed Balance Sheets Dollar Based (Monthly)
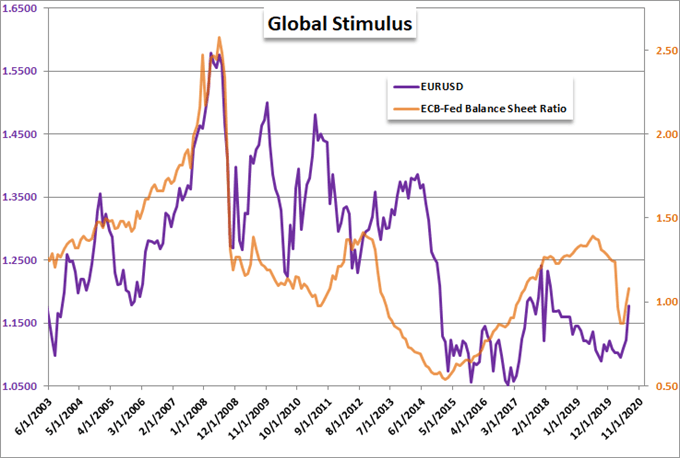
Chart Created by John Kicklighter with Data from FRED
Digging into the fundamentals behind the world’s most liquid currency pair, the contrast in the pandemic fight is just one matter of importance. Another more ‘mundane’ consideration is the state of stimulus between Europe and the US. Recently, the Fed has backed off its efforts while the ECB continues to seemingly raise the budget to ensure a ‘V-shaped’ recovery to turn into a ‘U’ or ‘W’. USDCAD may prove just such a pair catering to fundamental matters with high profile event risk on tap for Friday. For the Loonie, the interest falls to manufacturing sales, but the Dollar will find impact through retail sales, industrial production and University of Michigan’s consumer confidence survey.
Chart of USDCAD with 20 and 200-Day Moving Average with Disparity 200DMA (Daily)
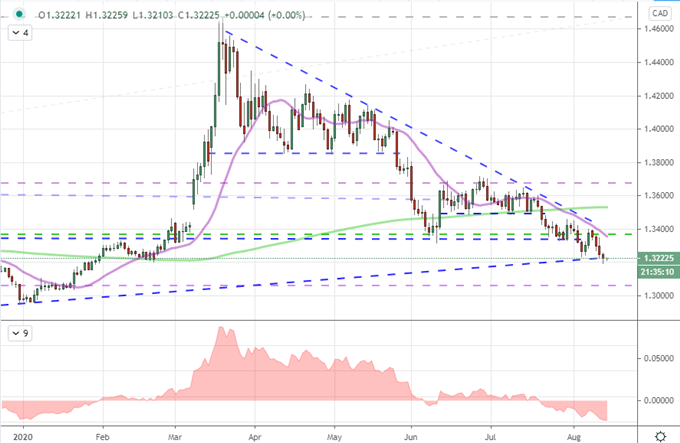
Chart Created on Tradingview Platform

If you want to download my Manic-Crisis calendar, you can find the updated file here.
.


