
EURUSD, Gold, Nasdaq Talking Points:
- There are a range of high-level breakout risks ahead for the Nasdaq 100 as ‘risk trend’ pacesetter, EURUSD pressuring a multi-year channel and Gold just a cent off record highs
- A systemic shift in sentiment remains my principal concern as US equities - and particularly FAANG members – pose a risk of leading investors over the ledge
- While the state of the coronavirus and knock-on issues like trade wars are persistent threats ahead; top scheduled risk includes the FOMC, US earnings and major 2Q GDP reports
A Range of Systemic Breakout Risks but Consider Market Conditions First
Some of the benchmarks that I follow most closely as measures of broader asset classes – and in some cases ‘risk appetite’ itself – have moved to the very verge of critical technical breaks. With a host of open-ended abstract risks such as the coronavirus spread and trade wars converging with a range of high-level scheduled events (FOMC, earnings, 2Q GDP data), it would seem that fundamentals and technicals are converging for a certain systemic break. However, I am mindful that the financial system has proven incredibly resilient to commitment; and that an abundance of high-level event risk can sometimes immobilize traders against a trend on one key development in anticipation of what the next may have to offer. Volatility is very likely ahead, but the threshold for our confidence in a new trend should remain very high.
Twitter Poll of First Major Market to Break
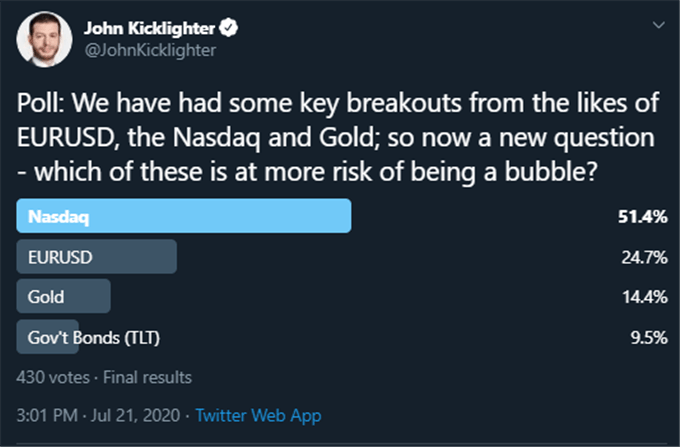
Poll from Twitter.com, @JohnKicklighter Handle
Looking out over the coming week, my anticipation for the top fundamental potential centers upon the same theme that it seems traders are concerned with – at least according to my poll asking which measure was at greatest risk of a bubble (Nasdaq, EURUSD, Gold or Treasuries). We are moving through the third week of the 2Q US earnings session, but this week will offer up the heaviest concentration for risk-sensitive traders. While I will monitor the likes of Gilead, Exxon and Ford; the real focus will be on Facebook, Amazon, Apple and Google. Three of those four ‘FAANG’ members is due to report on Thursday. These market leaders could offer another boost to flagging assurance...or they can crush it.

Chart of Nasdaq with 20-Day and 200-Day Moving Averages (Daily)
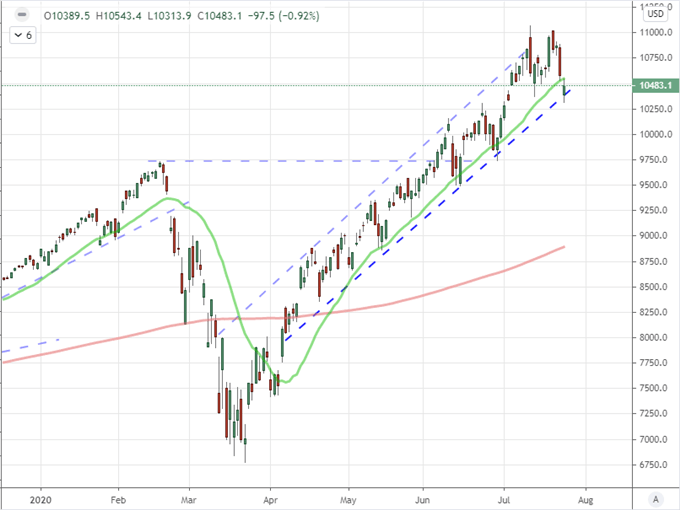
Chart Created on Tradingview Platform
Read Paul Robinson’s article on some of the most impressive bubbles in recent market history.
If I had to whittle the focus down even further beyond global risk appetite to US equities to Nasdaq 100 to FAANG components; I would put Amazon at the top of my watch list. Not only is this company one of the top market cap tech firms that investors have great appetite for, but it is also a focal point for consumption trends that are under close scrutiny given the very dubious outlook for global growth amid the pandemic.
Chart of Apple and Amazon Overlaid in Blue (Daily)
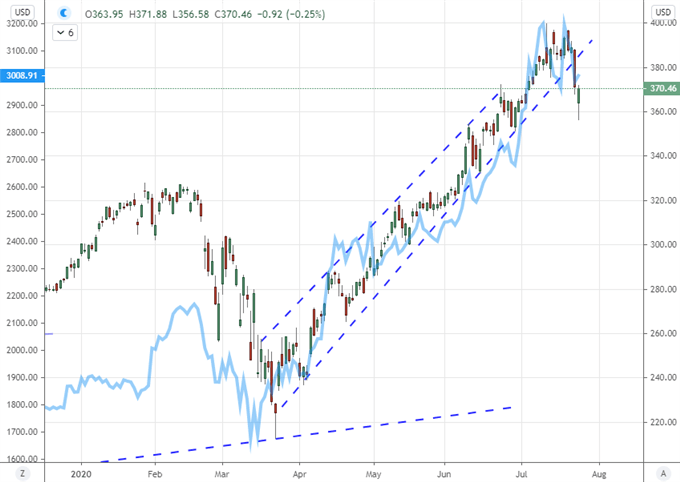
Chart Created on Tradingview Platform
Dollar Is on the Verge of Breaking a 12-Year Trend Channel, But Will it Break Now?
Meanwhile, there is a consideration of risk trends that should not be forgotten when monitoring EURUSD or the DXY Dollar Index. The Greenback, has extended its tumble this past week which has in turn bolstered the benchmark exchange range to the point where it faces a high-level trend reversal should it clear 1.1700/50. Backed by a consistent string of daily advances for the key pair, it would seem that hurdling channel resistance would be an easy feat with a FOMC decision and US 2Q GDP on tap. I wouldn’t be so confident of that however.
| Change in | Longs | Shorts | OI |
| Daily | 0% | 5% | 2% |
| Weekly | 71% | -43% | 7% |
Chart of EURUSD with 200-Bar Moving Average (Daily)
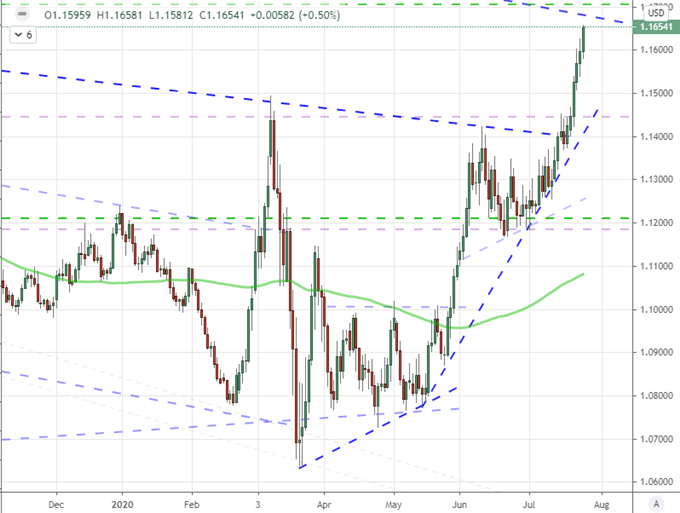
Chart Created on Tradingview Platform
Zooming out on the EURUSD chart to something on the weekly or monthly chart, we better appreciate the scale of commitment we are facing should we truly go for a breakout. This is no small technical feat. A tide change in conviction would need to take place. Should we expect that from the Fed? They have already raised their stimulus efforts to record levels and now have good reason to wait and see the if their efforts will pay off. Meanwhile, the 2Q US GDP release is already seen as a lagging indicator given the more timely figures hitting the wires lately – like the July US PMIs. If anything, a shift in risk trends could potentially revive the Dollar recently-diminished haven role as liquidity appetite could hold and fulfill a large range.
Chart of EURUSD with 200-Bar Moving Average (Monthly)
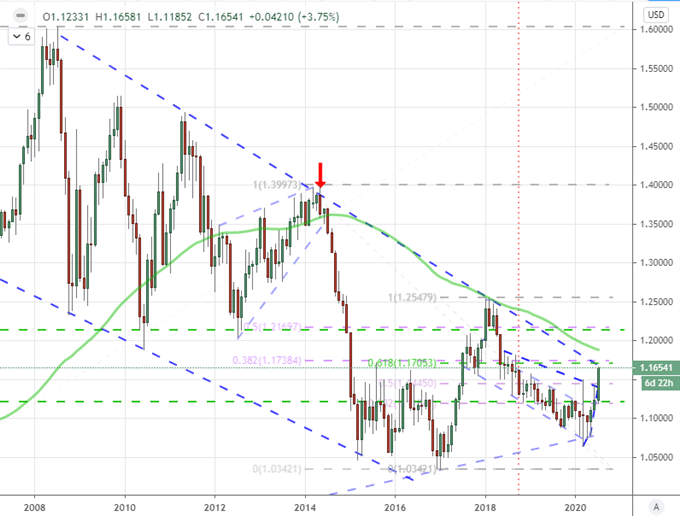
Chart Created on Tradingview Platform
Dollar Influence Versus Risk Appetite or Alignment to Risk Appetite?
The Dollar’s slide is having more impact than just EURUSD. In the FX world, we have even seen USDJPY breakdown from a remarkably restrictive range lasting more than a month. Yet, the world’s most liquid currency isn’t just a pricing measure for other currencies. It is also a backdrop for many of the world’s most important commodities. Consider that for gold. We usually price the precious metal in dollars whether it is explicitly XAUUSD or futures. Therefore the slide in the USD is likely ushering gold to its recent dalliance with record highs. Friday’s close was literally one cent below the record high daily close back in 2011.

Chart of Gold (Monthly)
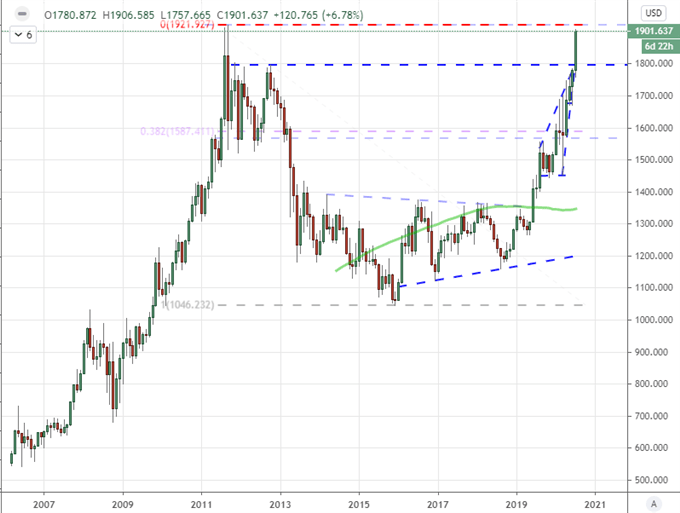
Chart Created on Tradingview Platform
If we were to put the question of risk a Dollar role as a haven into consideration next week, what impact would that have with regards to gold? Both are consider safe havens. The metal has been positively correlated to risk benchmarks like the S&P 500 recently while the currency has slid as a natural contrasting haven. There is debate to be had here, but something to take note of: gold priced equally in Dollar, Euro, Pound and Yen is pushing record highs itself and has pushed the upper boundary since February.
Chart of Gold Equally-Weighted in Dollar, Euro, Pound and Yen (Weekly)
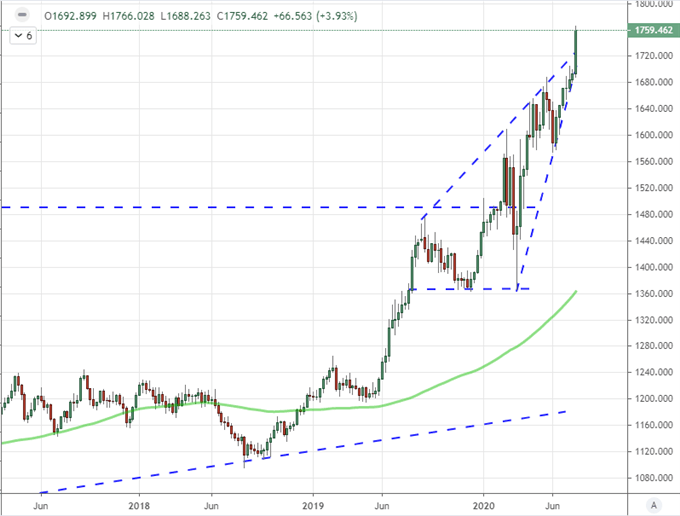
Chart Created on Tradingview Platform

If you want to download my Manic-Crisis calendar, you can find the updated file here.
.