


S&P 500, EURUSD, Tesla, Gold Talking Points:
- The S&P 500 advanced Monday to its highest close in five months, but it was the Nasdaq 100’s record high session end that once again stole day
- Earnings remain a top theme with Tesla a top performer with anticipation leading the actual release on Wednesday
- EURUSD closed at its highest level since January 2019 while Gold edged to a peak last seen since November 2011, but neither seemed to support a ‘genuine breakout’
The Difference Between a Break and a Renewed Trend
Earning a technical breach on a well-defined range and recharging a true breakout with following through are two separate events. To start this new trading week, we registered some technical milestones that would certainly register with the observant technical trader. The S&P 500 managed to trade at its highest close in five months. Yet, taking it a step further, EURUSD’s close doesn’t have a comparable historical reference until January 2019. Far more impressive however was gold’s advance through its recent range to stretch bounds that reach all the way back to the closing months of 2011. Every one of these has earned high-level progress; and each looks to still lack the necessary conviction to earn follow through.
Twitter Poll of First Major Market to Break
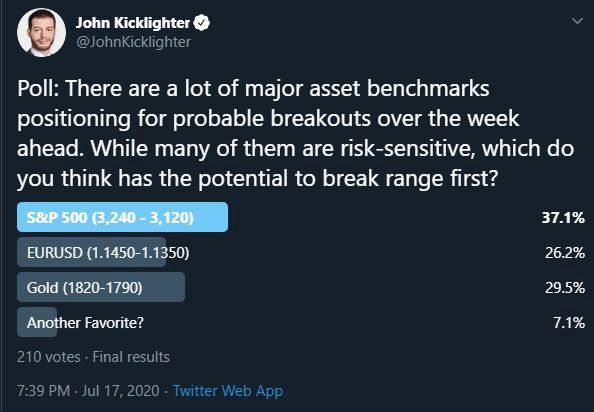
Poll from Twitter.com, @JohnKicklighter Handle
First and foremost, my attention tends to go back to the most popular index in the derivatives world: emini futures; SPY ETF and options that source the VIX volatility index. Technically speaking, the index closed above 3,250 and in turn stretched the bounds on a range top that some may raise with the double top back in June or consider a range high starting with February’s gap lower. While it did earn a new high close, the 4-day range (as a percentage of spot) is still the restrained activity level for this milestone dating back to February 20 before the fireworks began. A slow advance in some ways would be more reliable, but the traditional fundamentals simply don’t offer a meaningful endorsement for follow though.

Chart of S&P 500 with 4 Day Historical Range as Percentage of Spot (Daily)
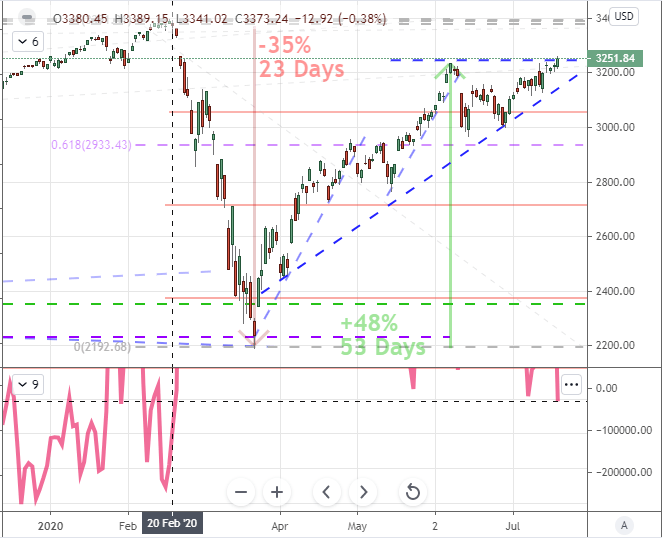
Chart Created on Tradingview Platform
Another interesting perspective to consider is the speculative positioning supporting the climb for the SPX and other milestones. As it happens, the net speculative futures figure for this benchmark has trended persistently towards neutral these past weeks. This is strong evidence that the market is acclimating to a backdrop where prevailing winds don’t match up to fundamentals…and perhaps that doesn’t bother some. It does raise extra caution from myself however.
Chart of S&P 500 and COT’s Net Speculative Futures Positioning (Daily)
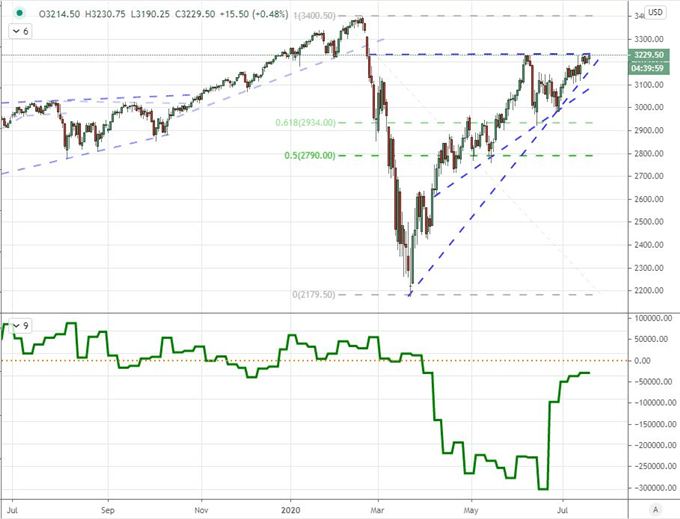
Chart Created on Tradingview Platform
FOMO Rears Its Head Once Again
In a market where traditional matters of value take a backseat, we are witnessing heavier speculative weighting. When that appetite for return, and particularly capital gains, overrides the consideration of further value-led gains, it is increasingly likely that we are dealing with a state of FOMO (fear of missing out). In such a backdrop, there is often skepticism over the value to be found in the market, but he inexplicable momentum can be enough to drive speculators to cast aside their doubts and join the reach. This can last for an indefinite time, but it also creates an unstable backdrop. It also leverages the importance of speculative pacesetters like Tesla which is increasingly reflecting bubble-like price action and is due to report earnings on Wednesday.
Chart of Ratio Nasdaq 100 to S&P 500 Overlaid with Tesla (Daily)
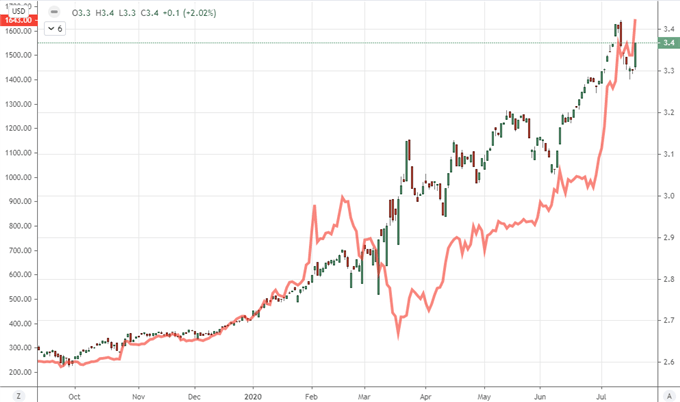
Chart Created on Tradingview Platform
Another tentative break I’m watching closely is the slow advance from EURUSD – at least on a close over close basis. Monday, the world’s most liquid pair ended just below 1.1450; yet in doing so, it was the highest the FX benchmark put in for since January 2019. The weekly chart offers better perspective for resistance that is slowly being overrun (trendline, long-term range midpoint and range high), but it is also worth mentioning the move into a fifth consecutive week’s advance which is the longest stretched since the exhaustion move in early 2018.
| Change in | Longs | Shorts | OI |
| Daily | -10% | -4% | -8% |
| Weekly | -13% | 35% | 0% |
Chart of EURUSD with Consecutive Weeks Move and Net Spec Positioning (Weekly)
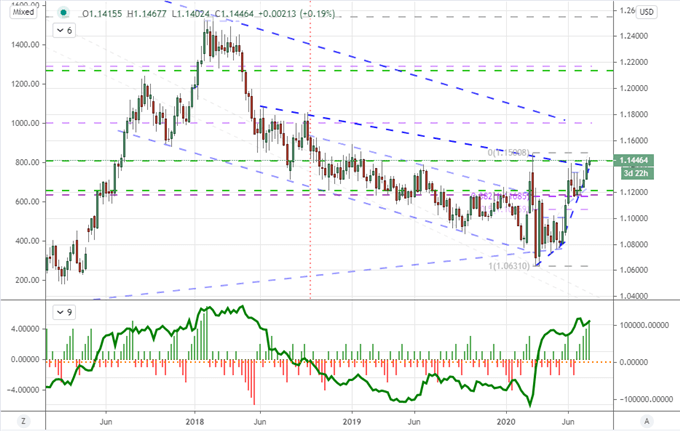
Chart Created on Tradingview Platform
Safe Havens Still Matter – Especially When Investors Seem to Cast Them Aside
In EURUSD, there is some measure of risk asset / safe haven dynamic at play; but the there is just as much speculation around the competitive efforts of stimulus programs as Republican Congressional leaders seemed to be pushing a second round of stimulus checks and payroll tax cut as a questionable next step. In contrast, European leaders’ inability to come to an understanding on the 750 billion euro rescue program doesn’t seem to draw as much concern. Stimulus is consider a crucial stabilizing for the financial system, and it is also an indirect means of traditional fiscal assets being devalued. When that happens, Gold gains a greater prominence as an alternative to traditional currencies. The metal may have merely inched higher Monday, but that crawl earned a fresh eight-and-a-half year high.
Chart of Gold with 10-Day ATR (Daily)
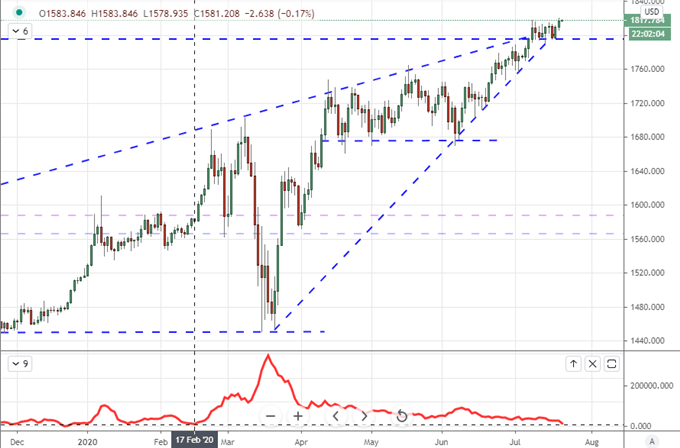
Chart Created on Tradingview Platform
While it may seem that speculative enthusiasm can power the market through the foreseeable future, it is important to keep tabs on the backdrop for points of erosion. I remain vigilant on the headlines around the pandemic. The cases of new Covid positives dropped Sunday, but the underline trend continues to drive higher. This is a pressing threat to economic health as the risk of a return to economic shutdown grows, but reports of success on vaccines from Oxford, Novavax and Moderna among others feeds a preference for hope and speculative appetite.
Google Report of US New Coronavirus Cases (Daily)
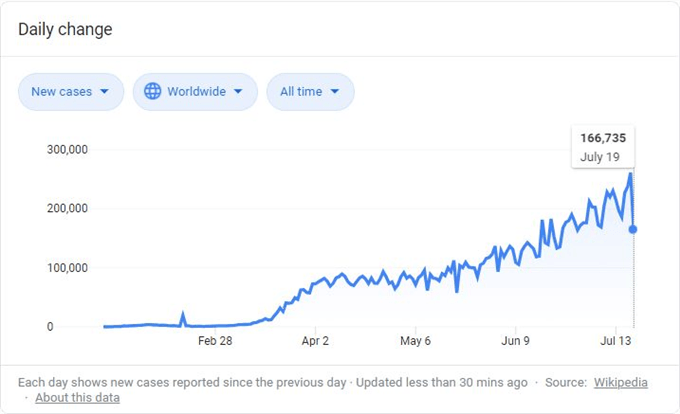
Chart from Google, Data from Wikipedia

If you want to download my Manic-Crisis calendar, you can find the updated file here.
.


