


Nasdaq 100, Dollar, Gold Talking Points:
- Headlines this past session were crowded with reports of a surge in key US tech stocks like Tesla, Amazon and Google only to be throttled further by a sharp reversal
- Risk trends have been concentrated in the momentum-prone tech sector of the US equity market – and that trend setting can cut both ways
- US earnings is a theme most traders seem to be focused on and the season starts Tuesday, yet focus on stimulus may ultimately shift the focus elsewhere
Risk Aversion Takes a Dangerous Jog Lower
This trading week is already off to a remarkable start. Risk appetite opened Monday off at a slow canter through the Asian and European sessions, but the markets caught a speculative wind when the US came online. Speculative appetite was charged through the first half of the New York trading session only to come utterly unraveled through the second half of the day. The U-turn in sentiment was evident across the board – in terms of asset class – but there was perhaps no more extraordinary about face than the reversal in the Nasdaq 100. From a nearly 2 percent peak for this tech-heavy benchmark intraday over Friday’s close, the market ended up down by the same percentage. That is an extraordinary about face – one that some observers say doesn’t have comparison until we reach back to the Dot-com bubble.

Chart of Nasdaq 100 Index
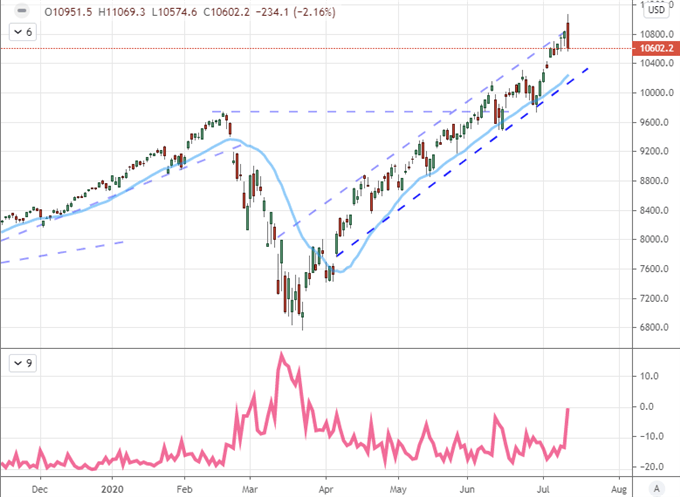
Chart Created on Tradingview Platform
The reversal from the Nasdaq accompanies high profile turns from the likes of Tesla, Amazon, Apple and many other pace setters from the past three months – and three years for that matter. The tech sectors has gain serious prominence as a speculative oasis whereby revenues may be safeguarded from the revenue drain on brick and mortar businesses impacted by the shutdown to combat the coronavirus. That may be the case in the short-term, but the reality is that persistent recession renders benefit from online marketplaces moot. The tech sector has played a crucial role in defining normalcy in risk trends. A reversal in the key tech players – like Tesla which drew an incredible interest Monday – bodes particularly poorly for more passive areas of risk trends that have carried on through momentum alone. If the tech leader falls apart, the outlook for sentiment-at-large should come under serious scrutiny.
Chart of Tesla Overlaid with Ratio of Nasdaq to Dow (Daily)
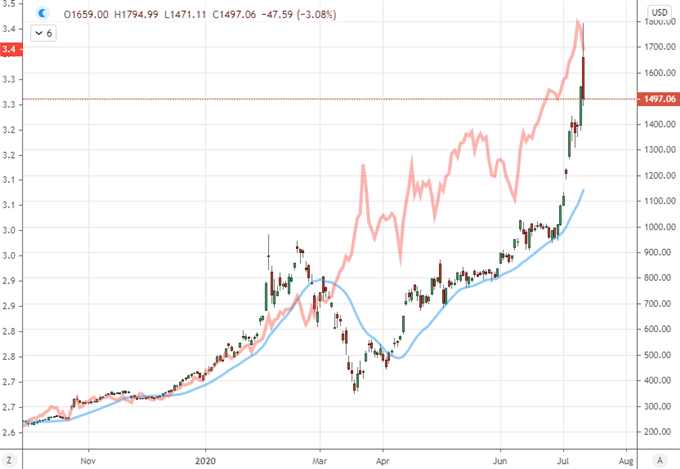
Chart Created on Tradingview Platform
What Will Carry Markets to Recovery or Collapse?
As we see the violent volatility in risk appetite play out to start this week, it is important to keep track of the high-level fundamental event risk that can take the reins on conviction moving forward. To understand what headlines or scheduled event risk catches traction, it is important to first understand where most market participants’ beliefs are centered. So, I put the question to a vote in Twitter: ‘what do you think is driving sentiment’. By a wide margin, it seems the majority feels confidence is rooted in central bank largesse. That is remarkable as it is inherently a limited and unstable backdrop for capital markets (click here to learn more on what role central banks play in Forex markets).
Poll of Why Markets Maintain a Bullish Bias
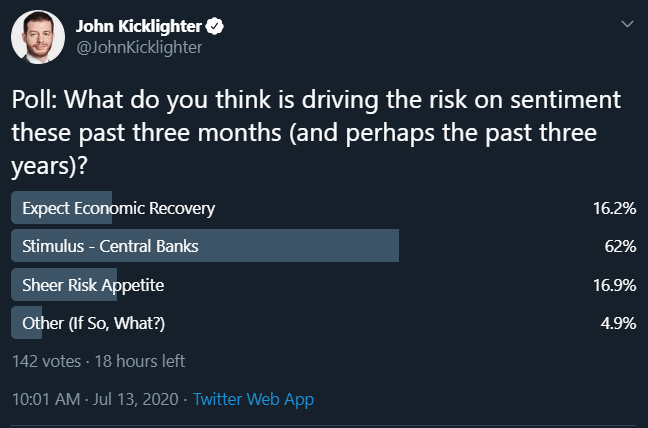
Poll from Twitter.com, @JohnKicklighter Handle
With a stimulus focus, we can in turn better evaluate what impact top scheduled event risk may have on market activity. As such, I decided to ask what traders in Twitter thought was the top listed event risk was for market movement over this week. Though the ECB rate decision was an option, the vast majority placed their confidence in US earnings. There is certainly a monetary policy / temporary relief factor in this US capital market insight. This week, the financial sector is the focal point of the ‘corporate America’ discussion; but my real interest will be in Netflix figures as the least-remarkable FAANG member reporting later this week.
Poll of the Top Market Moving Event Risk Next Week
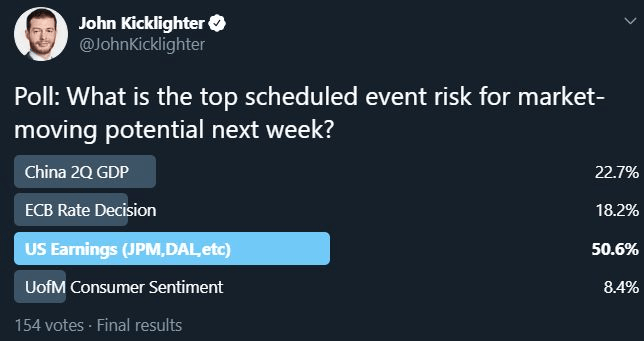
Poll from Twitter.com, @JohnKicklighter Handle
It is interesting to compare and contrast the expectations and realities of the US financial and tech sectors. For the former, the impact of recession and loan growth caps alongside fears of defaults has led to an estimated halving of profit from the banks through the second half. Expectations against that view are naturally very low. In contrast, the tech sector seems to be flying high with an ill-placed sense of immunity which has pushed the Nasdaq and its components to remarkable highs. That said, we aren’t getting the Netflix figures as the first FAANG update until Thursday after-hours.
Chart of SPY Tech Sector Index Overlaid Financial Sector Index (Daily)
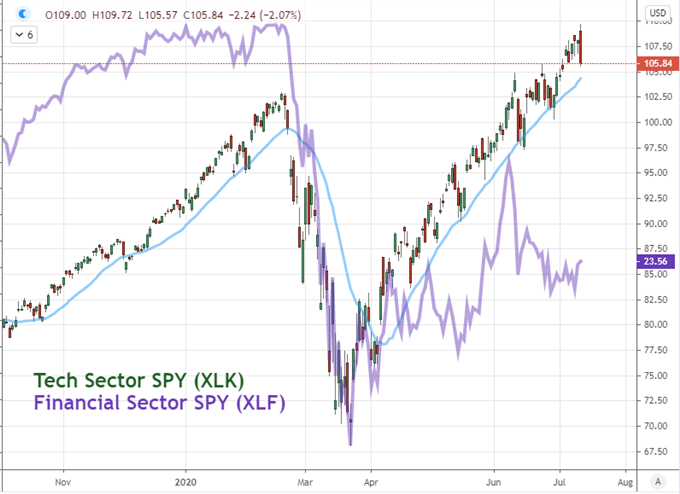
Chart Created on Tradingview Platform
Markets to Watch for Context: Gold, Dollar and Pound
While my focus into the coming session will be on risk trends and the key milestones of this systemic backdrop along the way, it is important to keep tabs on the measures that can offer useful insight in asymmetrical ways. For example, haven alternatives to tech sector outperformance is a useful rudder. Gold for example has been climbing alongside the appetite for US tech shares which likely reflects the underlying skepticism for outright risk appetite but also the influences of stimulus to fuel run.
| Change in | Longs | Shorts | OI |
| Daily | 3% | -5% | -1% |
| Weekly | 12% | 3% | 7% |
Chart of Gold Overlaid with Nasdaq-Dow Ratio (Daily)
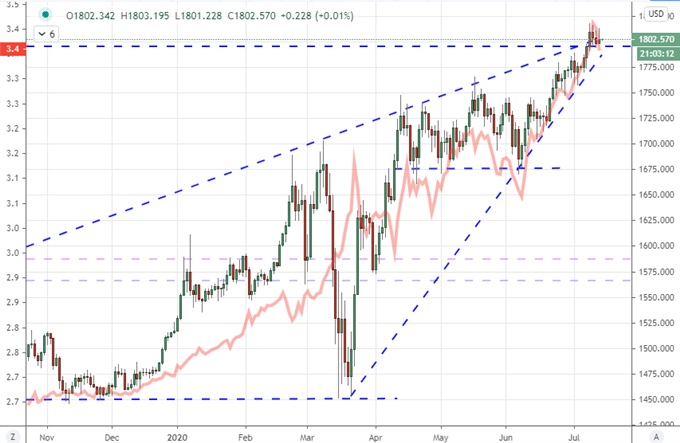
Chart Created on Tradingview Platform
Another benchmark of risk appetite on my radar is the US Dollar. The Greenback has not really stood as the sensitive haven of previous months or years lately, but its role is unmistakable when extreme skepticism comes into play. If risk aversion kicks in at the same time the DXY Dollar index catches a bid, my interpretation of risk aversion will take a very different tint.

Chart of DXY Dollar Index Overlaid with VIX Volatility Index (Daily)
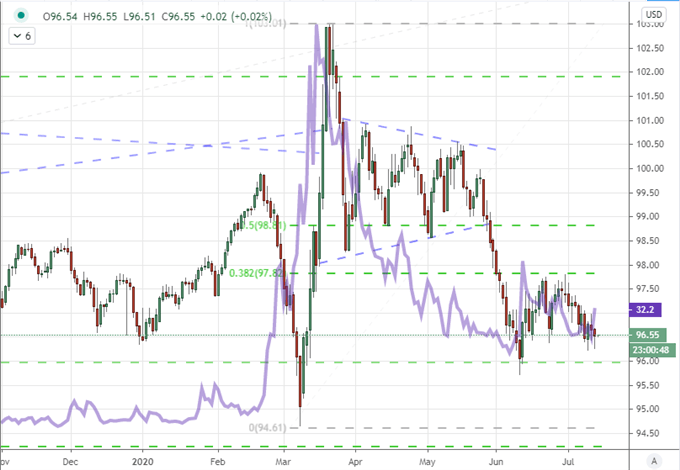
Chart Created on Tradingview Platform
Of course, if you are looking to avoid the systemic for more concentrated volatility, there are a few high-profile releases of merit through Tuesday’s session. I will be watching the British Pound most closely. There are trade figures and industrial production on tap, but the May GDP update is by-far the most loaded release on the calendar. Given the depth of interpretation centered on the turn around in performance from April to May worldwide, it is easier to disappoint than impress here. If that is the case, pairs like GBPUSD and EURGBP are interesting. Then again, if the data does impress, I’ll be watching GBPAUD.
Chart of GBPAUD with 20-Day Moving Average (Monthly)
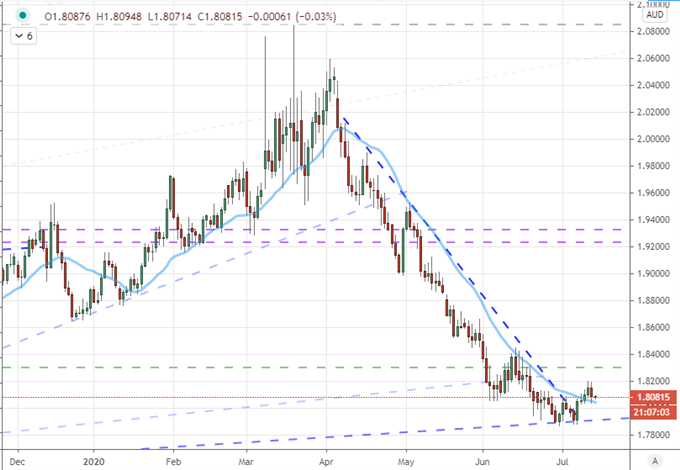
Chart Created on Tradingview Platform

If you want to download my Manic-Crisis calendar, you can find the updated file here.
.


