


Gold, Nasdaq, Shanghai Composite Talking Points:
- Chinese capital markets regained traction this past session to push the Shanghai Composite back into its aggressive climb while USDCNH has slipped below 7.0000
- Recession concerns around COVID’s spread are regaining traction, but trade wars may be a more pressing concern if reports of USDHKD pressure pan out
- Gold is has resolved its technical pressure build up with a bullish clearance of 1,800 – what does this market’s advance say about the financial system?
Risk Appetite is Restored…for a Select Few
Speculative appetite had the wind to its back again this past session. That said, the performance was once again centered upon a very narrow field of measures that seems to signal an exaggerated appetite for momentum rather than so-called ‘value’. Through the US session, the preference for tech shares once again lifted the Nasdaq 100 over its more prominent counterparts such as the S&P 500 or Dow. The NDX in fact managed a fresh record high close which would contrast notably in ratios to the SPX or VEU (rest of world equities ETF). It is the habit of many traders to seek out the top performing measure; but in this case, concentration for a particular few risks undermining the climb for all.
| Change in | Longs | Shorts | OI |
| Daily | -3% | -2% | -2% |
| Weekly | -4% | -6% | -5% |
Chart of the Nasdaq 100, S&P 500 in Green and VEU All-World Ex US ETF in Purple (Daily Chart)
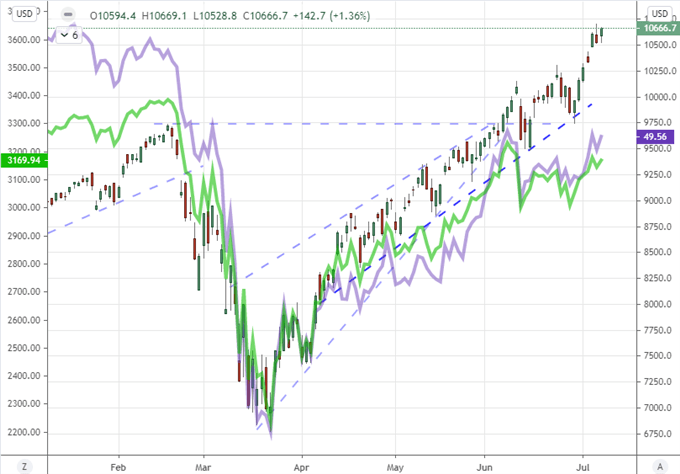
Chart Created on Tradingview Platform
In another reference to speculative inconsistency, the underwhelming charge for global equities, junk bonds and carry trade suggests the general lift behind investor confidence risks falling apart with a decisive fundamental cue. A particularly interesting disconnect reflecting on the unusual environment in my opinion is the distinct divergence between the EEM emerging market ETF which follows capital market assets for the segment and the underwhelming course for EM currencies. It is possible that a universal preference for assets like equities has developed universally, but we are not seeing that happen – consider the German DAX, UK FTSE 100 and others. What that boils down to for me is a climb in jeopardy.
Chart of EEM Emerging Market ETF and ZARUSD Exchange Rate in Red (Daily)
Chart Created on Tradingview Platform
Another peculiar outperformance based on temporary measures is the rally for Chinese equities. With only a temporary pause Tuesday, the Shanghai Composite hit a new high charged by the government’s implicit backing of local investors to put their capital to work. This is very similar to the situation in the Western World whereby central banks are acting as a backstop, but some would argue that China holds greater sway in its own market. That said, risk appetite in this particular country does not convincingly offer foundation for indefinite global lift.
Chart of China’s Shanghai Composite Index (Daily Chart)
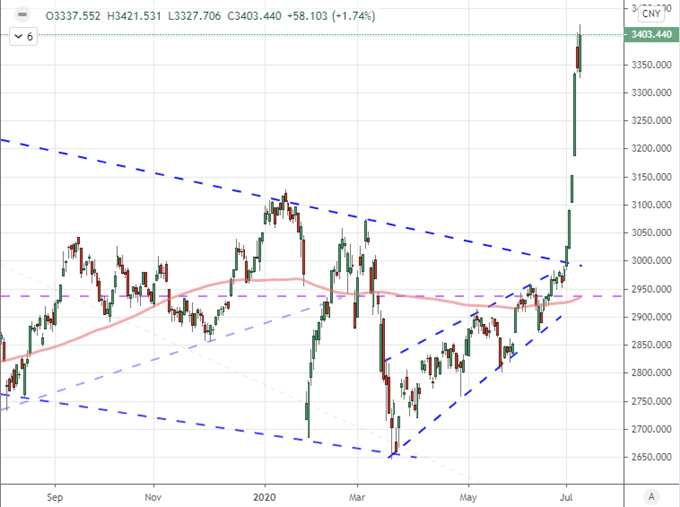
Chart Created on Tradingview Platform
Trade Wars Could Return to the Top Fundamental Spot
Fundamentally, the concern over stalled economic recovery amid the pandemic remains one of my principal concern for the foreseeable future. This past session, White House Economic Adviser Larry Kudlow remarked that there was some evidence of lasting economic damage from the pandemic as cases return to record highs in certain areas of the country. However, he maintained that the administration believes that a second shutdown would be a big mistake. As we watch this situation unfold though, global investors would do well to keep tabs on the top fundamental driver just five months ago: the fallout from trade wars. Officials from a range of countries (UK, Canada, Australia and the US) reportedly met and agreed that China’s steps to enact its security law on Hong Kong breached the agreement the country made as part of the transition. It was also suggested that some Trump Administration officials were considering actions to undermine the USDHKD peg, though that was officially denied. Nevertheless, it would be worth watching that pair along with USDCNH.
Chart of USDCNH Overlaid with USDHKD in Purple (Daily)
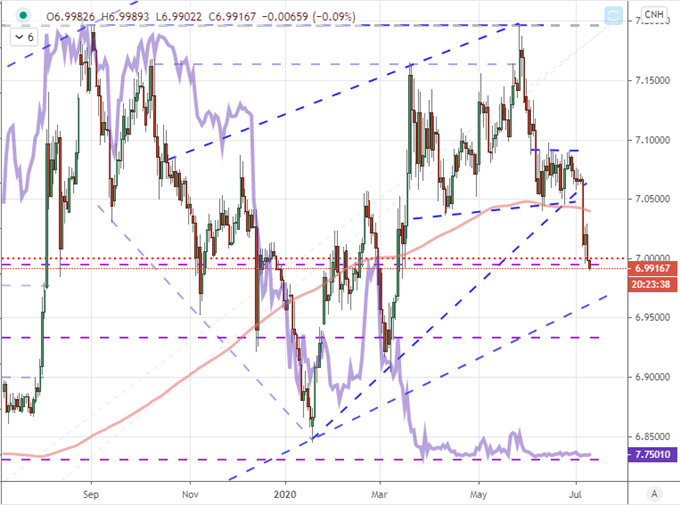
Chart Created on Tradingview Platform
Gold Marks a Critical Breakout
As the demand for risk appetite continues to draw an incredibly consistent degree of skepticism, it seems that there is a remarkable lack of conviction even as investors hold their noses to build their exposure. That is not the type of environment that buoys my confidence but rather directs me to keep my duration short and my radar for distorted appetite active. In a world where central banks and government intervention is playing a critical role in keeping investors in the market, there remains a strong foundation for gold. This precious metal is a haven that also happens to benefit from the depreciation in traditional fiat assets like currencies and fixed assets: a natural byproduct of these types of efforts to keep capital markets afloat.

Chart of Gold Overlaid with Aggregate of Major Central Banks’ Balance Sheet (Daily)
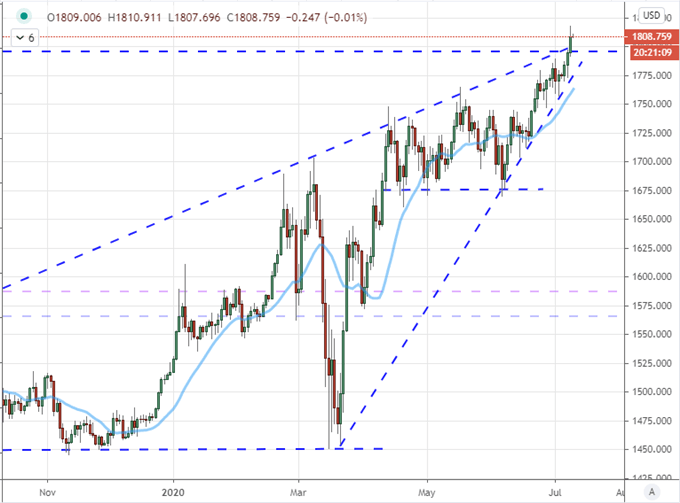
Chart Created on Tradingview Platform
The precious metal seemed to resolve its pressure build up between range resistance that stretched back to late 2011 and the advancing congestion of 2020. Clearing 1,800 does qualify as a break in my book, but we have seen plenty of technical clearances across the financial markets that simply lost traction and retreated these past months and even years. The difference for gold is that it has a fundamental role to play. As it stands, the metal is within 6 percent of the record high it set back in August 2011. Traders should watch this as a reflection of underlying sentiment as the likes of the Nasdaq 100 push records while market sentiment reflects a distinct distaste for the environment.
Chart of Gold (Monthly)
Chart Created on Tradingview Platform

If you want to download my Manic-Crisis calendar, you can find the updated file here.
.


